
The following report presents findings from North Carolina’s third quarter, prior to the impact of Hurricane Helene on Western NC. The fourth-quarter report will include data after October 1.
Highlights:
DMJPS is pleased to provide a statewide quarterly economic report with highlights of North Carolina’s fifteen metros for the third quarter of 2024. The state’s economic indicators reflect steady job growth and rising wages, alongside an uptick in unemployment.
- In the third quarter of 2024, North Carolina averaged 5,012,800 jobs and added approximately 78,500 jobs year-over-year.
- By major industry, third quarter employment gains were led by Education and Health Services with 25,000 net new jobs year-over-year.
- The Durham-Chapel Hill metro led employment growth in the third quarter with a 2.8 percent increase compared to the previous year.
- North Carolina’s average unemployment rate for the third quarter of 2024 was 3.9 percent, representing an average of 205,665 unemployed individuals. The estimated number of unemployed increased by 11 percent compared to the previous year.
- Among the state’s fifteen metros, Asheville had the lowest third quarter unemployment rate at 3.2 percent while Rocky Mount had the highest at 5.5 percent.
- The third quarter average hourly wage in North Carolina was $32.64 for a 3.8 percent increase compared to the previous year.
- At 4.8 percent, North Carolina’s same-home annual appreciation rate in the third quarter trailed the national average of 5.1 percent. The Goldsboro metro led the state metros with a 13.3 percent appreciation rate.
- Special feature, Labor Force Participation Rate: According to the U.S. Census Bureau, North Carolina’s labor force participation rate was estimated at 63.2 percent in 2023, the highest percentage within the 2013-2023 period, based on available data. Participation rates were higher among age groups between 20 and 59 years.
Detailed Analysis:
Employment
In the third quarter of 2024, North Carolina’s employment averaged 5,012,800 jobs which is currently the highest average recorded for any third quarter to date. Employment increased by an average of 1.6 percent year-over-year, slightly above the national average of 1.5 percent, and marked 14 consecutive quarters of year-over-year employment growth (Figure 1).
Figure 1
North Carolina Total Nonfarm Employment
Monthly Year-to-Year
Percent Change
 Source: US Bureau of Labor Statistics
None of the state’s 15 metros experienced employment loss in the third quarter of 2024 when compared to the previous year. Durham-Chapel Hill was North Carolina’s fastest-growing metro with a 2.8 percent employment increase (Figure 2). Raleigh, Greenville, and Goldsboro metros followed, each with a 2.4 percent increase. Ten metros surpassed both state and national growth rates.
Figure 2
2024 3Q Average
North Carolina Metros
Employment One-Year Percent Change
 Source: US Bureau of Labor Statistics
North Carolina’s unemployment rate averaged 3.9 percent in the third quarter of 2024, noticeably lower than the national rate of 4.3 percent (Figure 3). This marked the seventh consecutive quarter where the state’s rate was below the national average. The third quarter 2024 unemployment rate represented roughly 205,665 people in North Carolina that were unemployed and available to work. Compared to the previous year, the number of unemployed was up 11 percent.
Figure 3
North Carolina
Unemployment Rates (%)
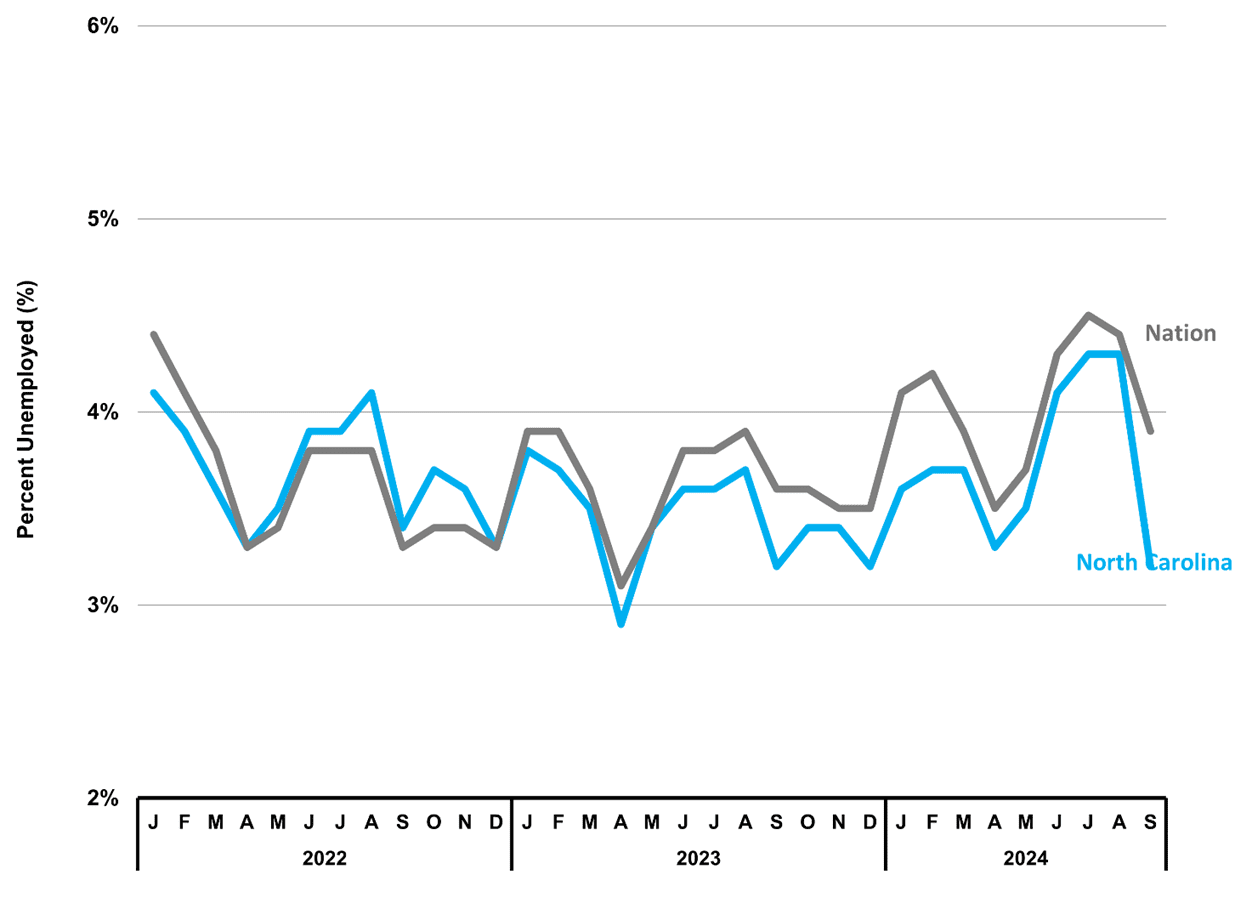
Source: US Bureau of Labor Statistics
Among North Carolina’s 15 metros, the Asheville metro recorded the lowest average unemployment rate in the third quarter of 2024 at 3.2 percent, followed by Wilmington metro at 3.3 percent (Figure 4). Nine of the state’s metros experienced average unemployment rates at or below the state average of 3.9 percent. Meanwhile, five metros — Greenville, Jacksonville, Greensboro-High Point, Fayetteville, and Rocky Mount — exceeded the national average of 4.3 percent.
Figure 4
North Carolina Metros
Unemployment Rate (%)
2024 3Q Average
 Source: NC Department of Commerce
North Carolina saw an overall gain of approximately 78,500 new jobs in the third quarter of 2024 compared to the prior year (Figure 5). Gains were led again by Education and Health Services with 25,000 net new jobs, followed by Leisure and Hospitality with 18,800 new jobs. Eight of 13 major industries experienced year-over-year employment growth in the third quarter. While job loss continued in Manufacturing (-3,000 jobs), this was a smaller decline compared to the previous four quarters.
Figure 5
North Carolina – 2024 3Q
Major Industry Employment
One-Year Change
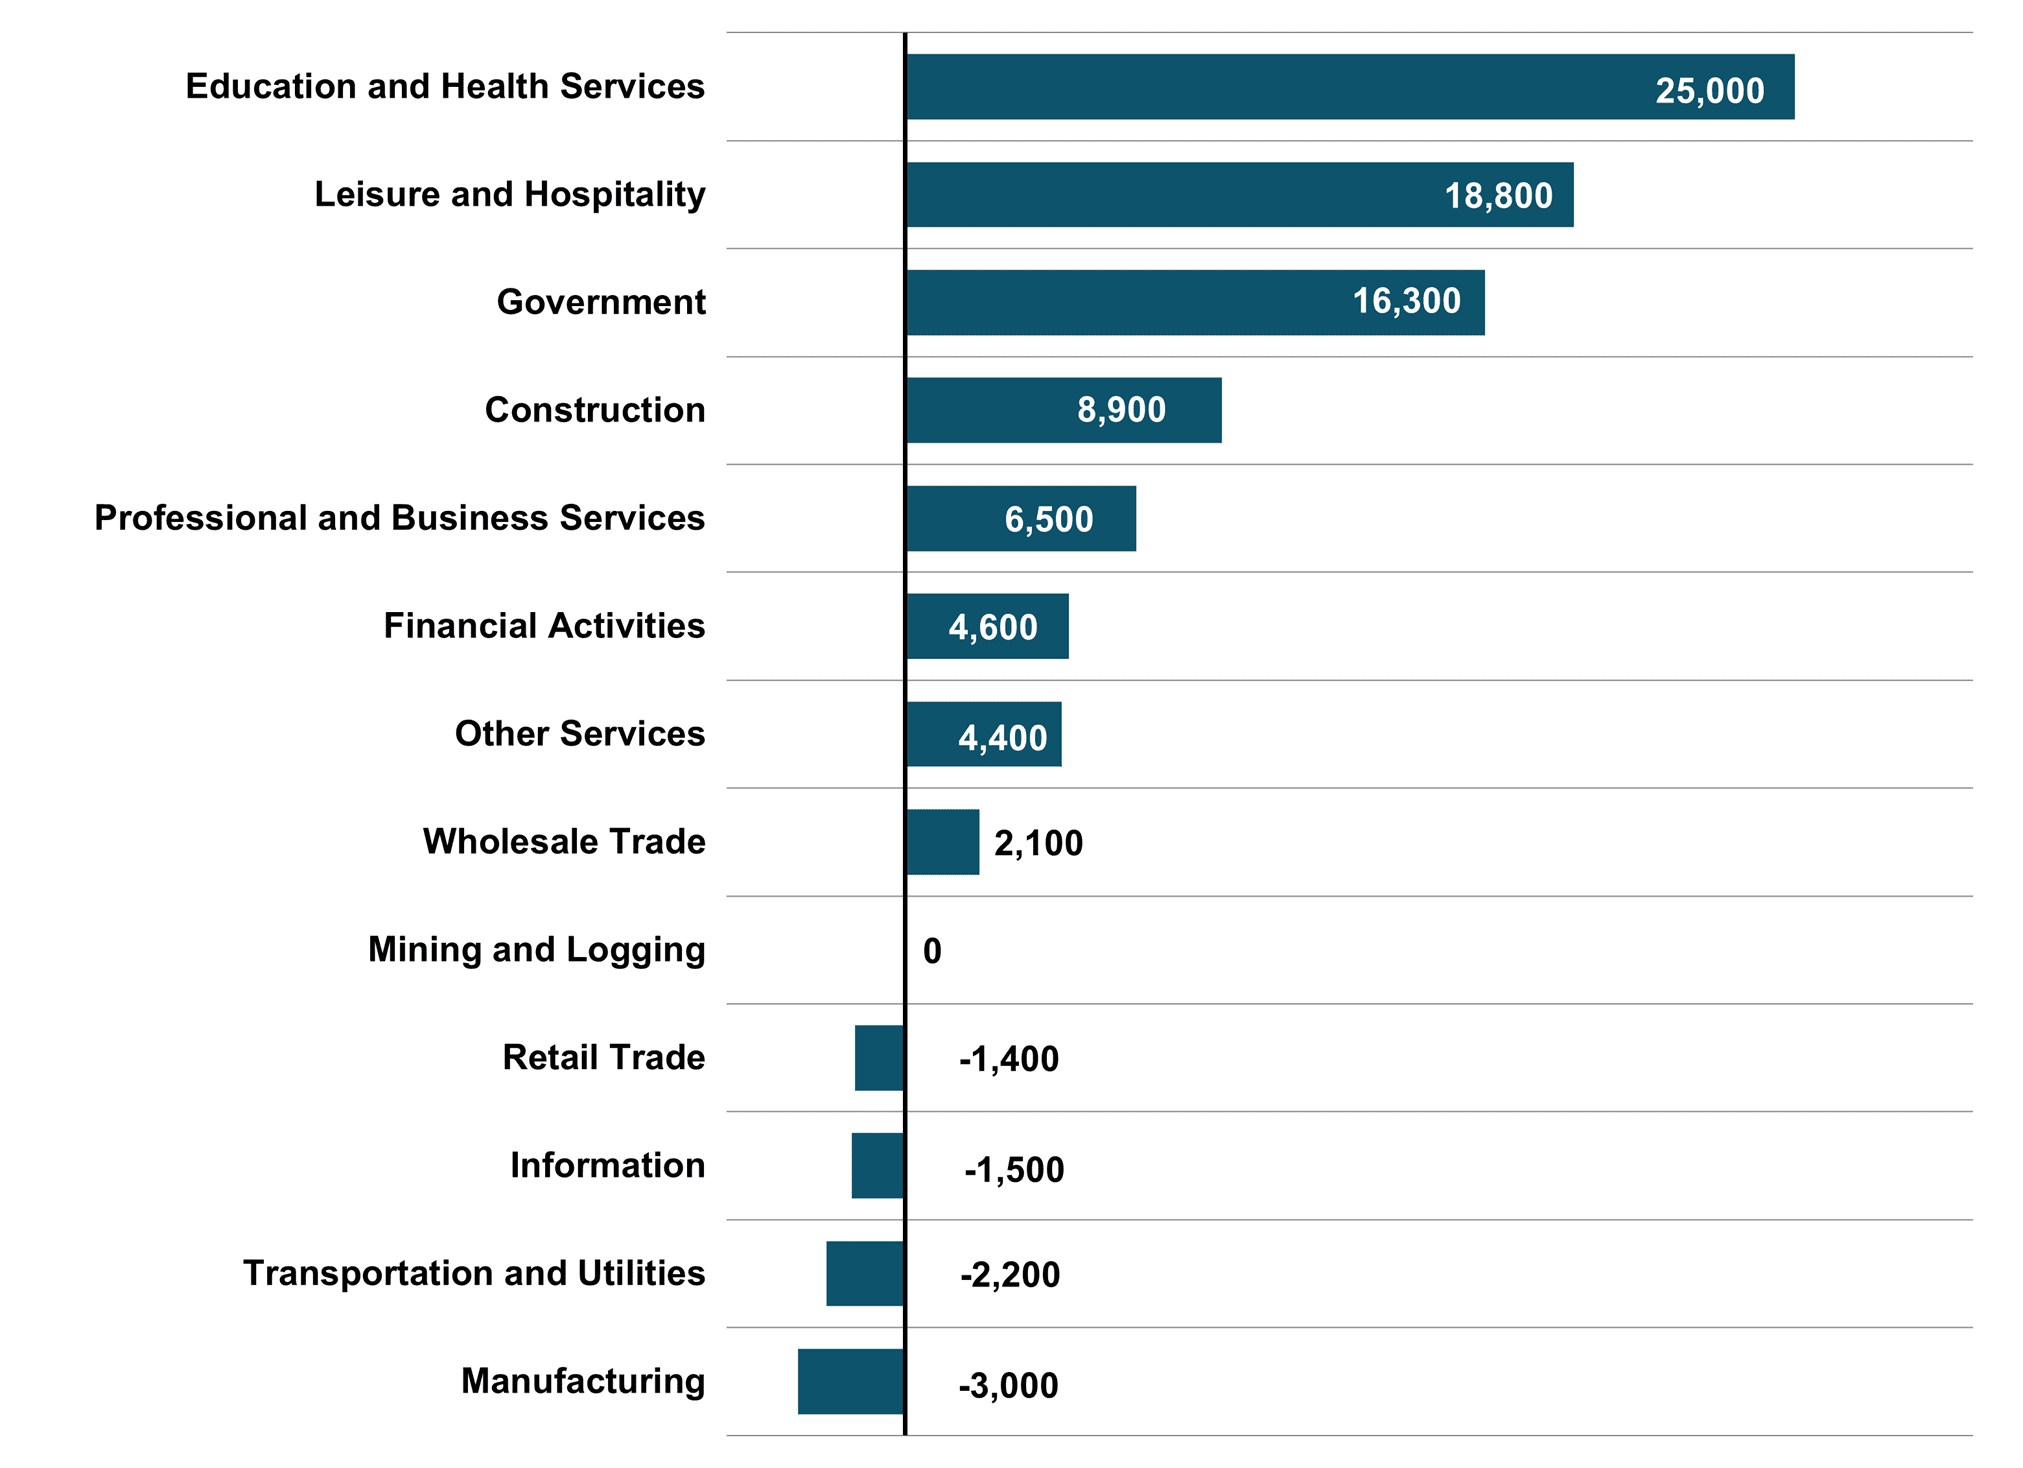 Totals rounded to nearest 100.
Source: US Bureau of Labor Statistics
Wages
Private industry average hourly wages in North Carolina reached a new high point at $32.64 in the third quarter of 2024, marking a solid 3.8 percent increase from the prior year (Figure 6). However, by comparison, the growth rate was slower than the previous quarter (4.8 percent) and the third quarter 2023 (4.3 percent).
Figure 6
North Carolina
Average Hourly Wages
Private Industry
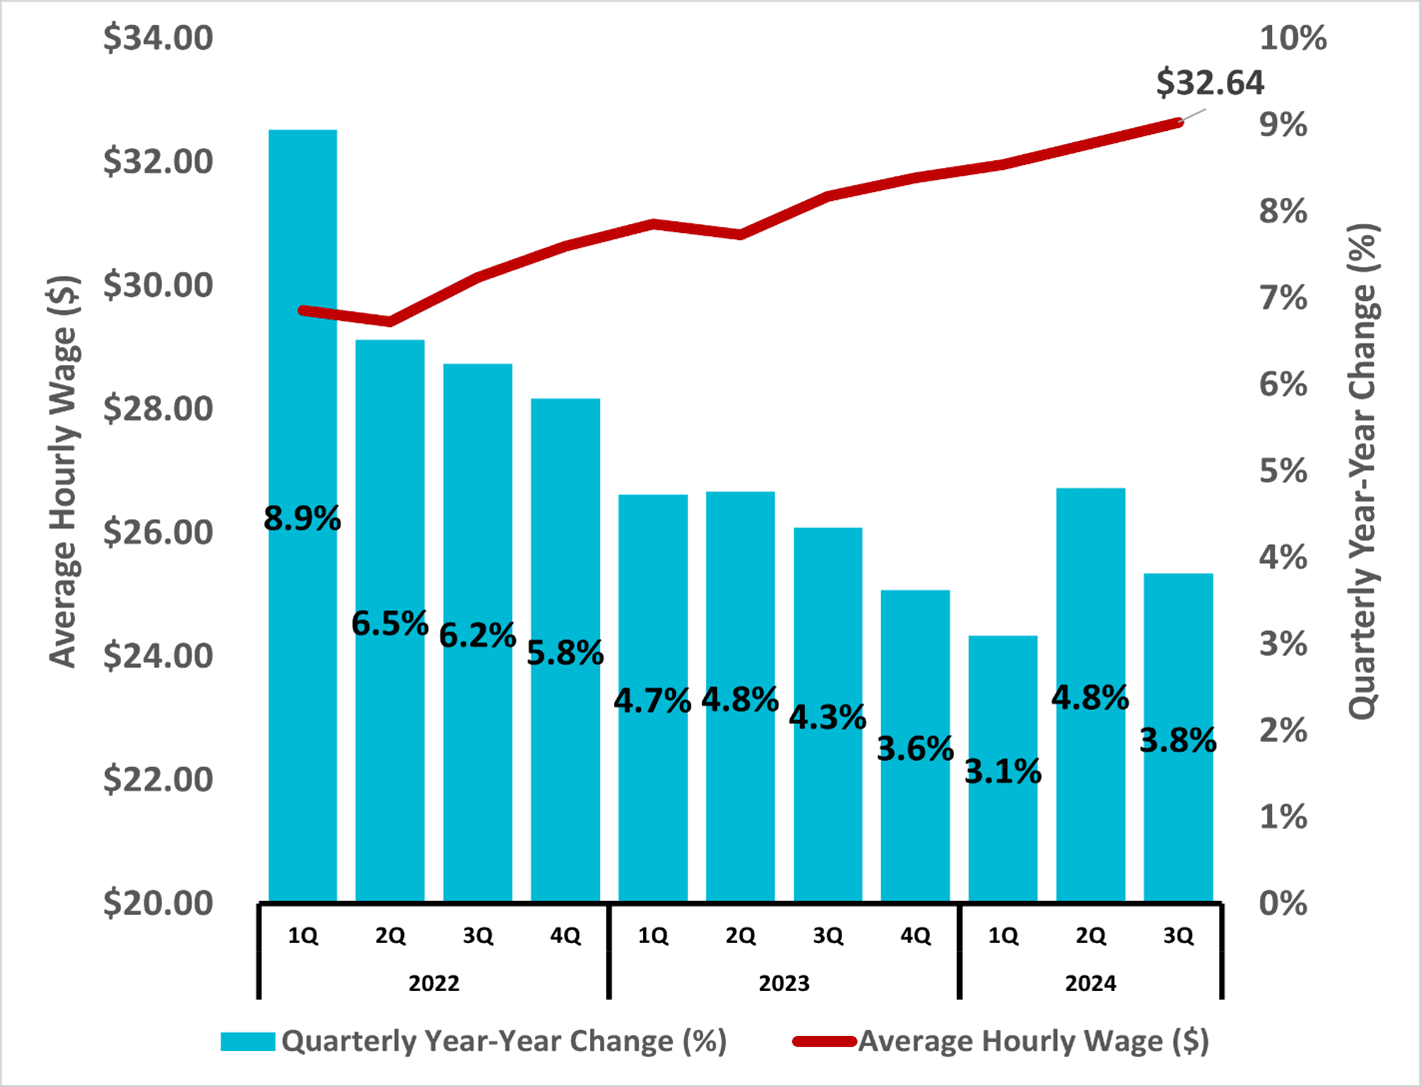 Source: NC Department of Commerce
Charlotte led North Carolina’s fifteen metro areas with an average hourly wage of $36.72 in the third quarter of 2024 (Figure 7). The Raleigh metro followed at $35.30, closely trailed by Durham-Chapel Hill at $35.28. These three metros exceed both the national quarterly average of $35.13 and the state average of $32.64. The majority of the state’s metro areas, however, recorded average hourly wages below the overall state average in the third quarter.
Figure 7
North Carolina Metros – 2024 3Q
Average Hourly Wages
Private Industry
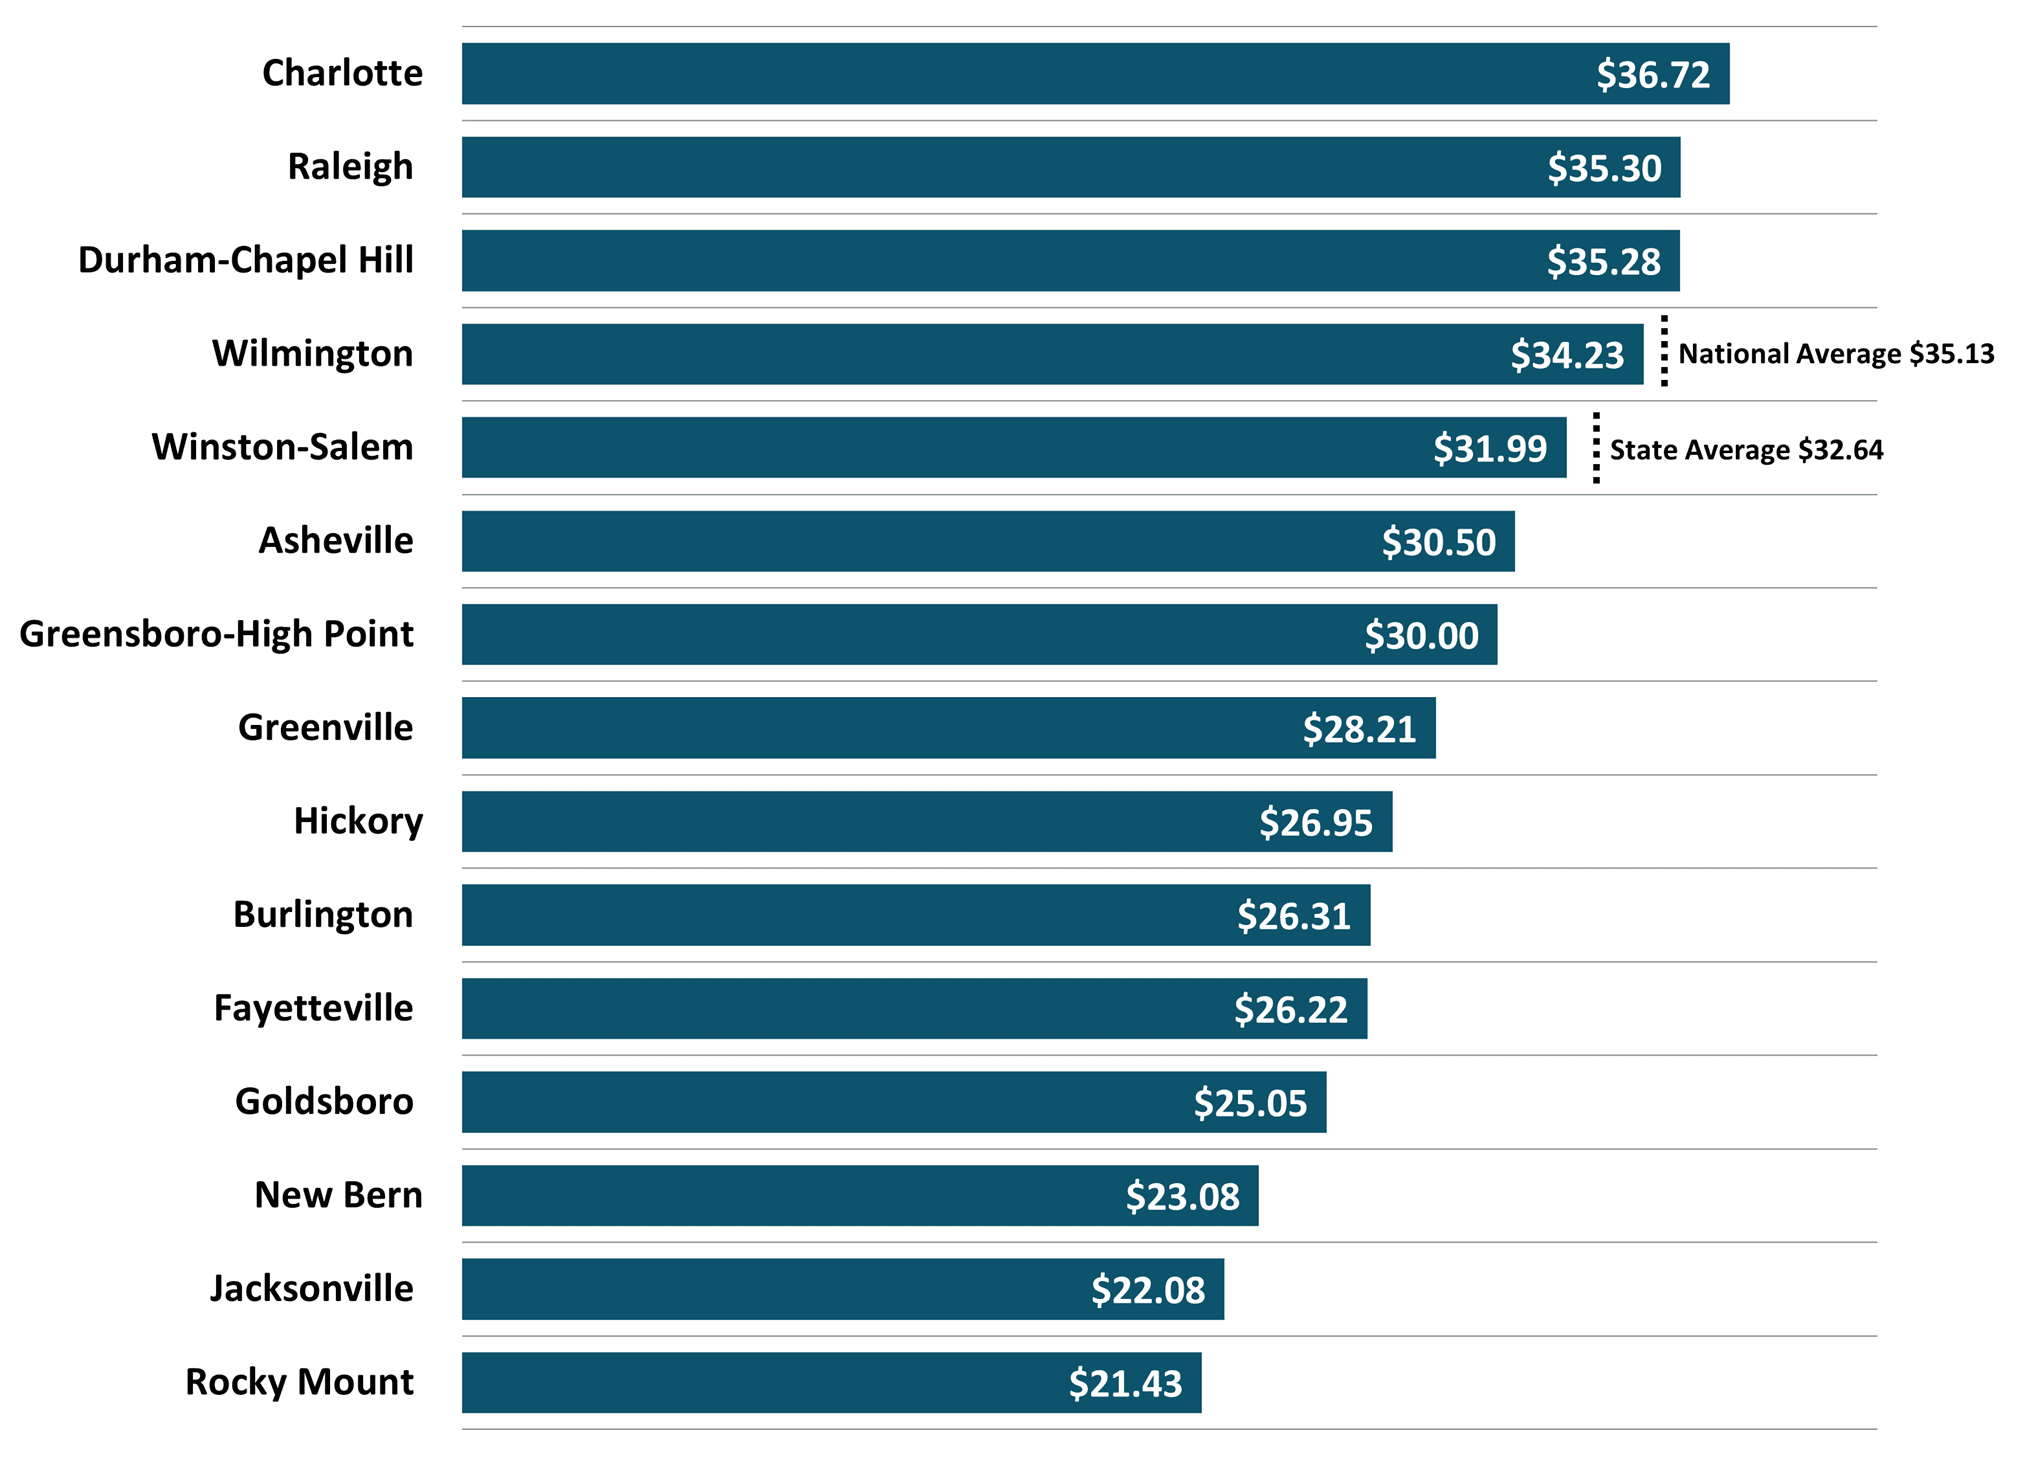 Source: NC Department of Commerce
Housing
North Carolina’s same-home annual appreciation rate stood at 4.8 percent in the third quarter of 2024, somewhat below the national rate of 5.1 percent (Figure 8). Among the state metros, Goldsboro led with a 13.3 percent appreciation rate. Eight of North Carolina’s metros exceeded both the state and national averages, and none experienced a year-over-year decline.
Figure 8
North Carolina Metros
Same-Home Annual Appreciation Rate (%)
2024 3Q
 Source: Federal Reserve Bank of St. Louis
Permit activity for new residential building in North Carolina was approximately 25,306 units in the third quarter of 2024 with a total value of $6,205,005,000 (Figure 9). This represented a 10.5 percent increase in the number of units permitted compared to the previous year and a 12.3 percent rise in total value. Multi-family units accounted for 7,973 permits, or 31.5 percent of units permitted.
Figure 9
North Carolina
Estimated Residential Building Permits Activity*
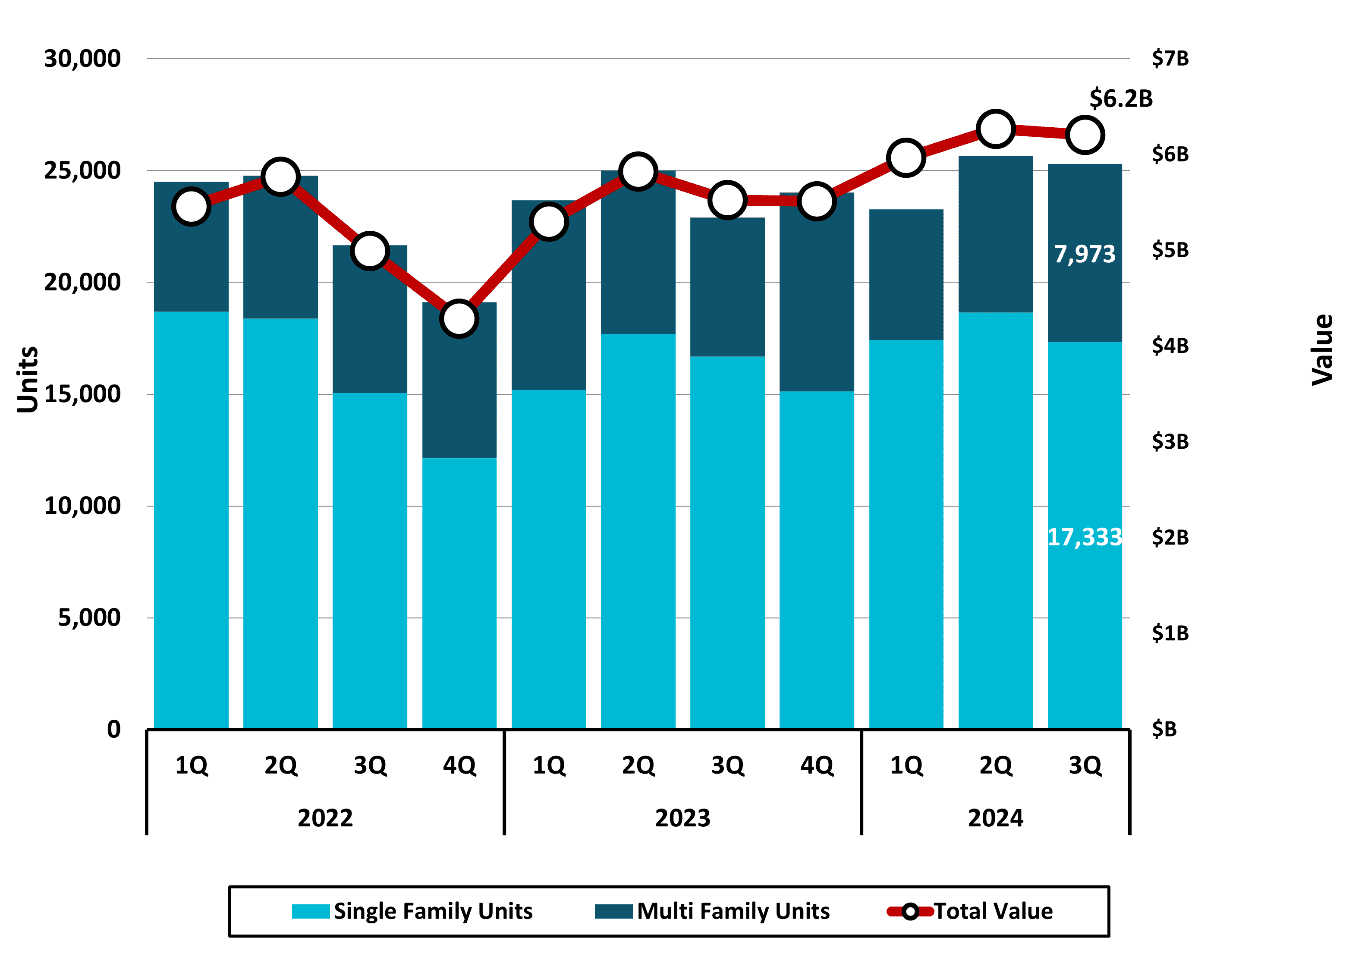 *Based on a survey of permitting agencies. The Census Bureau provides estimates for
any missing agency data, which typically amounts to less than 20% of the total permits.
Source: US Census Bureau
Retail Sales
Taxable retail sales in North Carolina totaled $59,607,440,423 ($59.6 billion) in the third quarter of 2024 (Figure 10). Although this is the highest sales estimate for any third quarter recorded, it represented a minimal 0.5 percent increase from the previous year– the slowest growth rate of any quarter dating back to 2020 (Figure 11).
Figure 10
North Carolina
Total Taxable Retail Sales
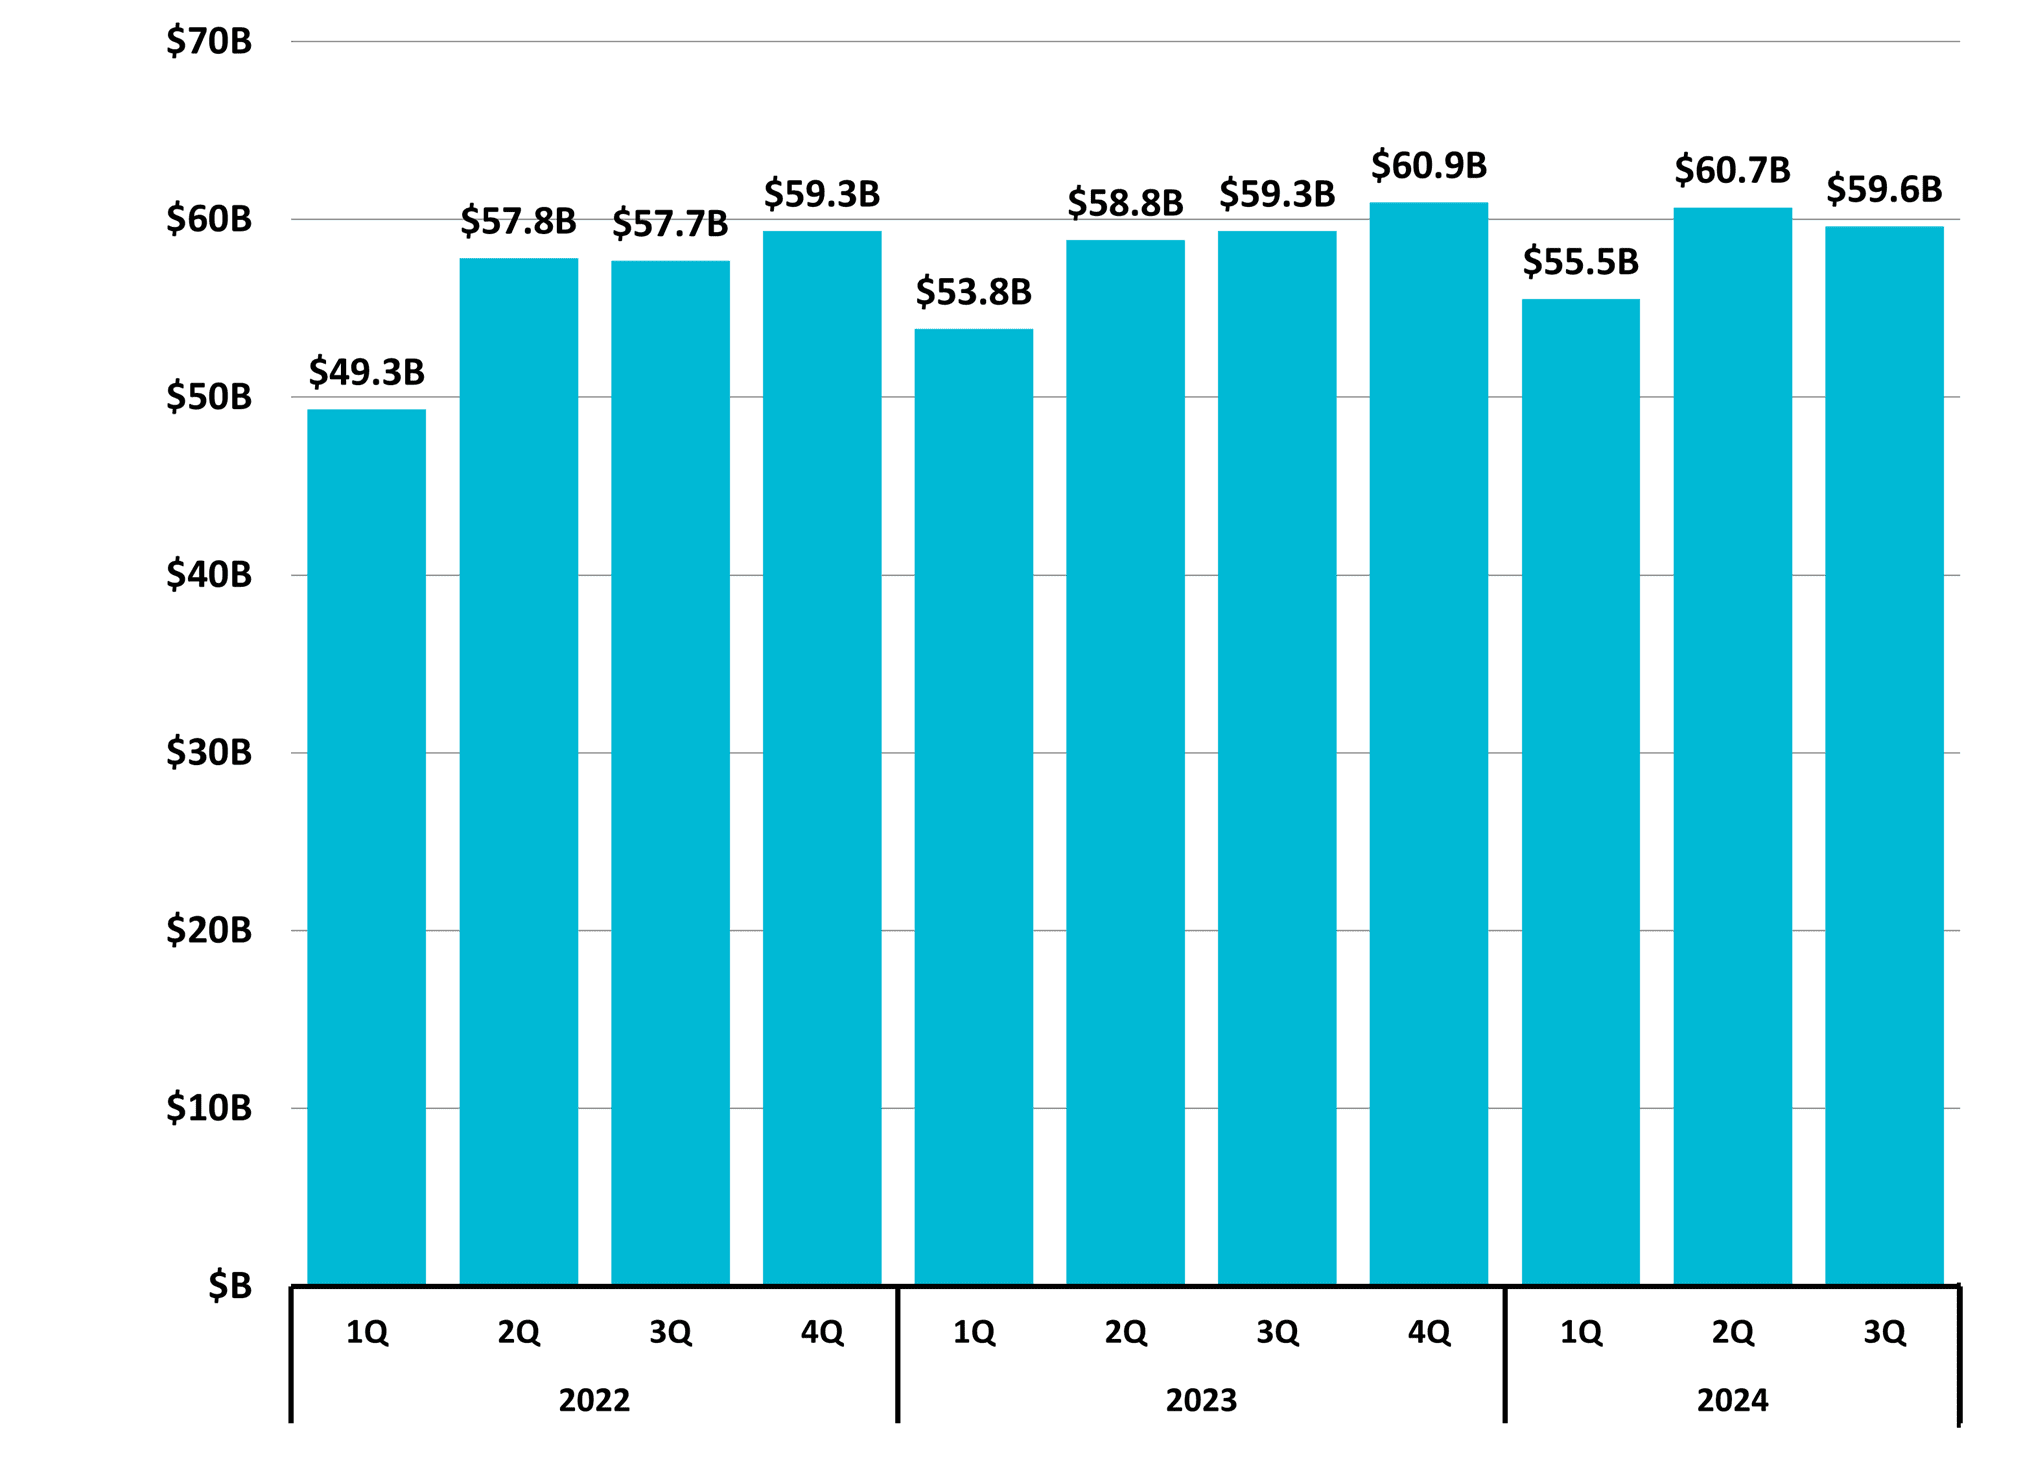 Includes collections of penalties, interest, and sales & use tax; and may reflect activity from prior periods.
Source: NC Department of Revenue
Figure 11
North Carolina
Total Taxable Retail Sales
Quarterly Year-to-Year Change (%)
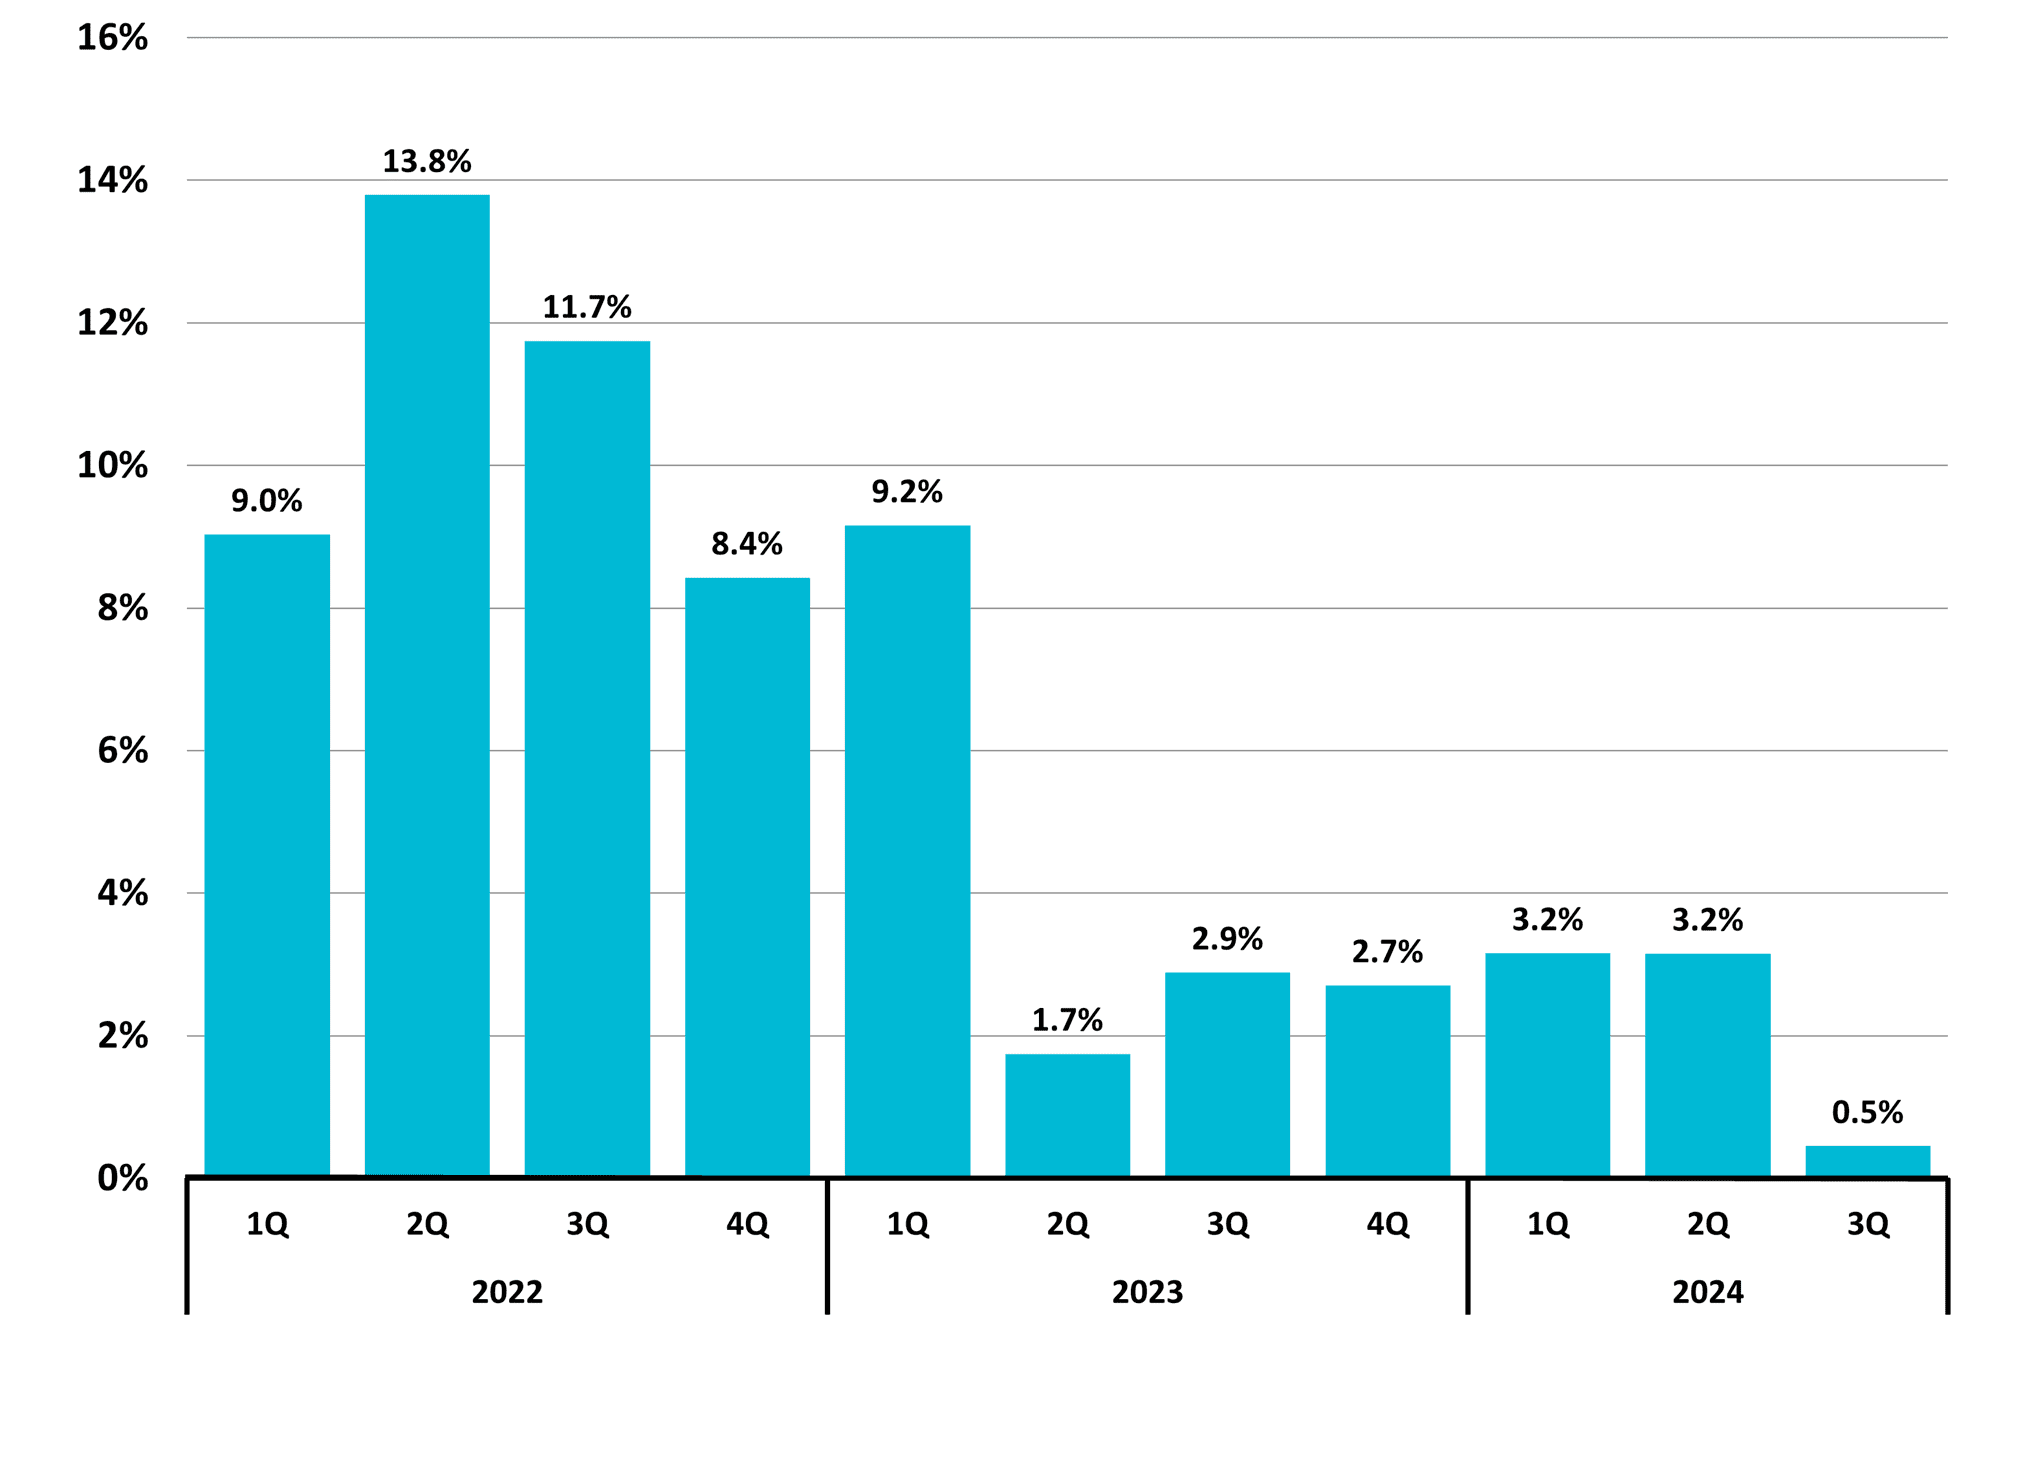 Includes collections of penalties, interest, and sales & use tax; and may reflect activity from prior periods.
Source: NC Department of Revenue
Special Feature:
Labor Force Participation Rate
The U.S. Census Bureau defines the labor force participation rate as the proportion of the population aged 16 years and over that is in the labor force. The labor force includes individuals who are employed, as well as those who are unemployed but seeking work. In 2023, the Census Bureau estimated North Carolina’s overall labor force participation rate at 63.2 percent (Figure 12). This was just slightly below the national rate of 63.8 percent and marked the highest labor force participation rate over the past decade, based on available data. Participation rates were notably higher among age groups between 20 and 59 years in 2023 (Figure 13).
Figure 12
North Carolina
Labor Force Participation Rate
Population 16 Years and Over
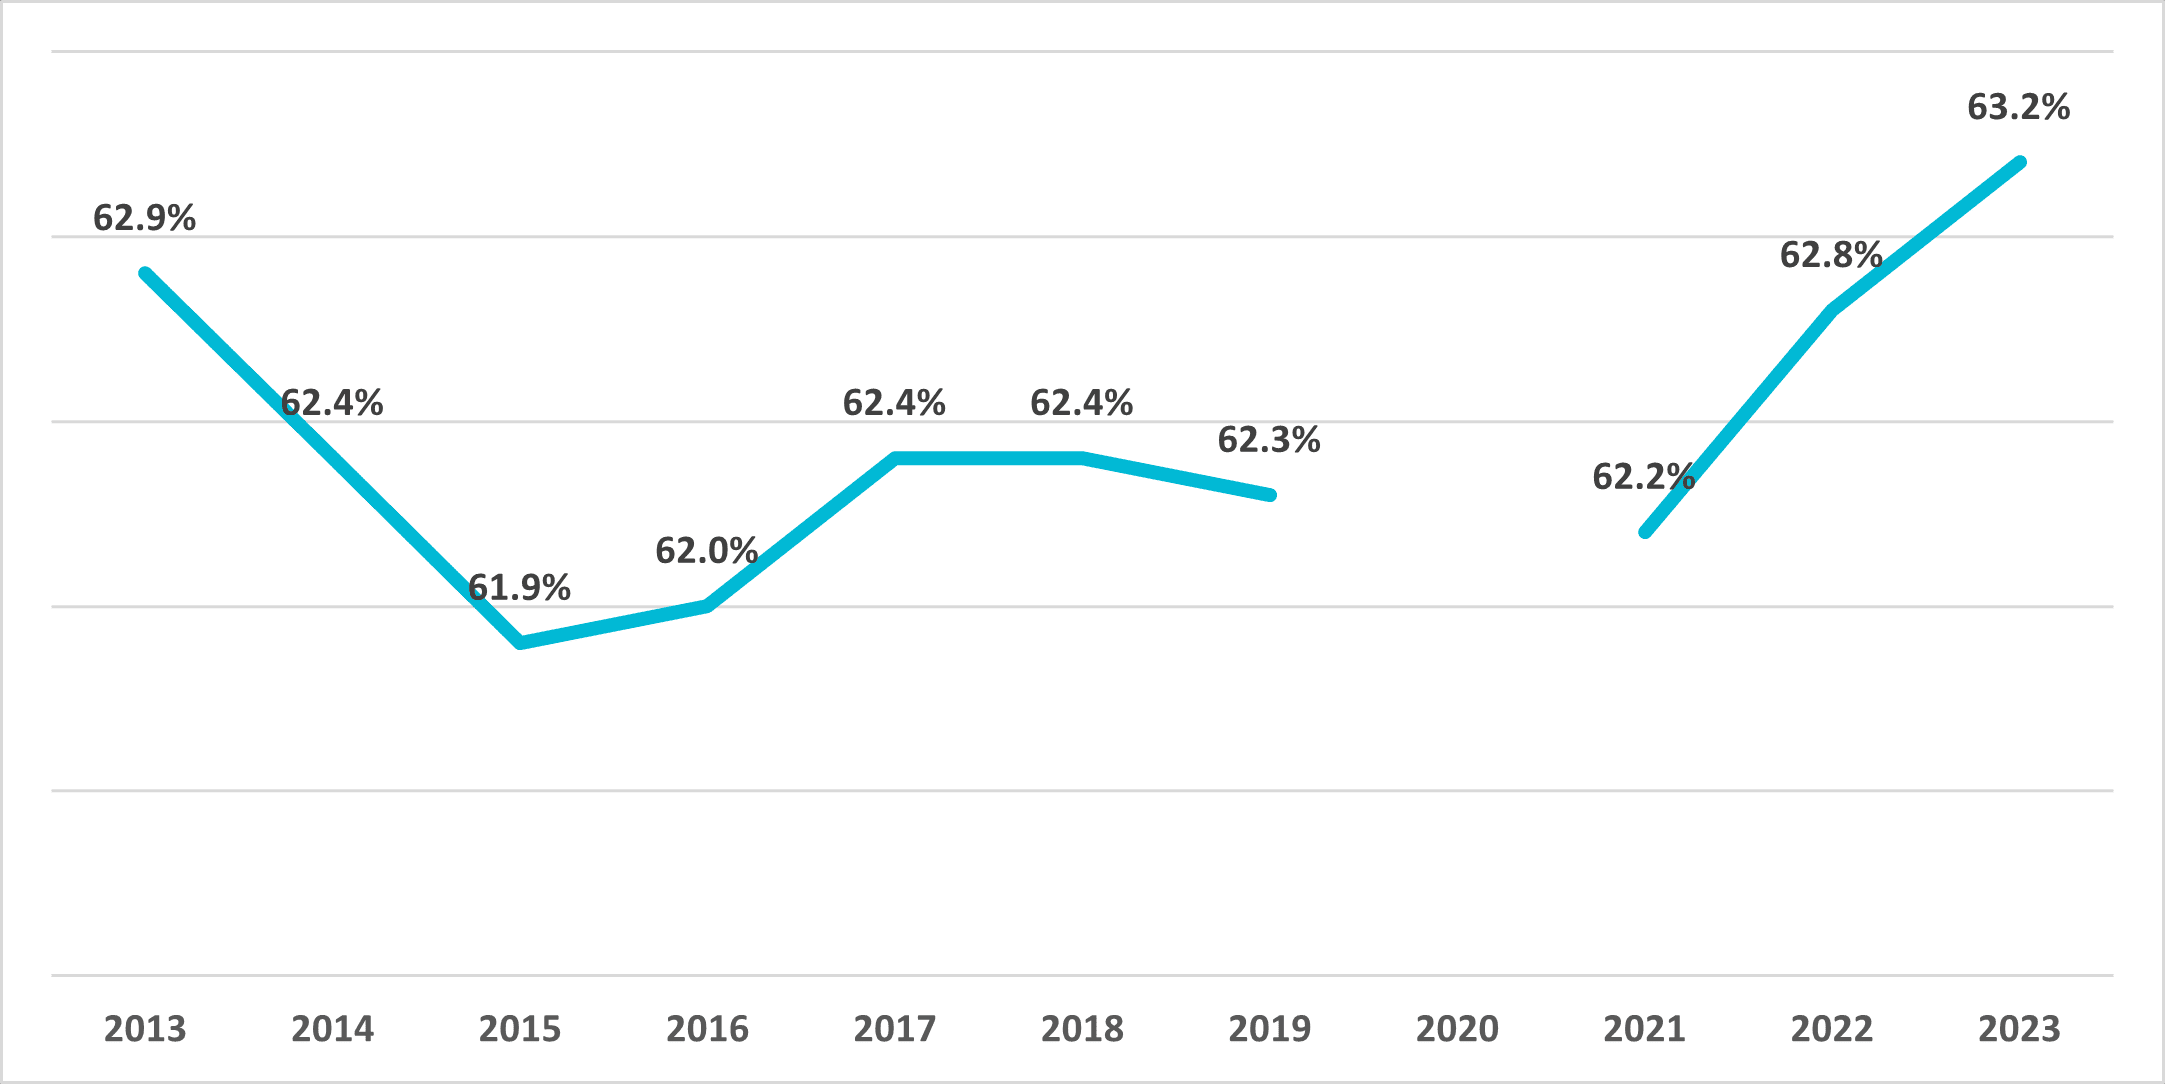 Source: US Census Bureau, American Community Survey, 1-Year Estimates
Note: there is no data available for 2020 in the 1-year estimates
Figure 13
North Carolina- 2023
Labor Force Participation Rate by Age Group
Population 16 Years and Older
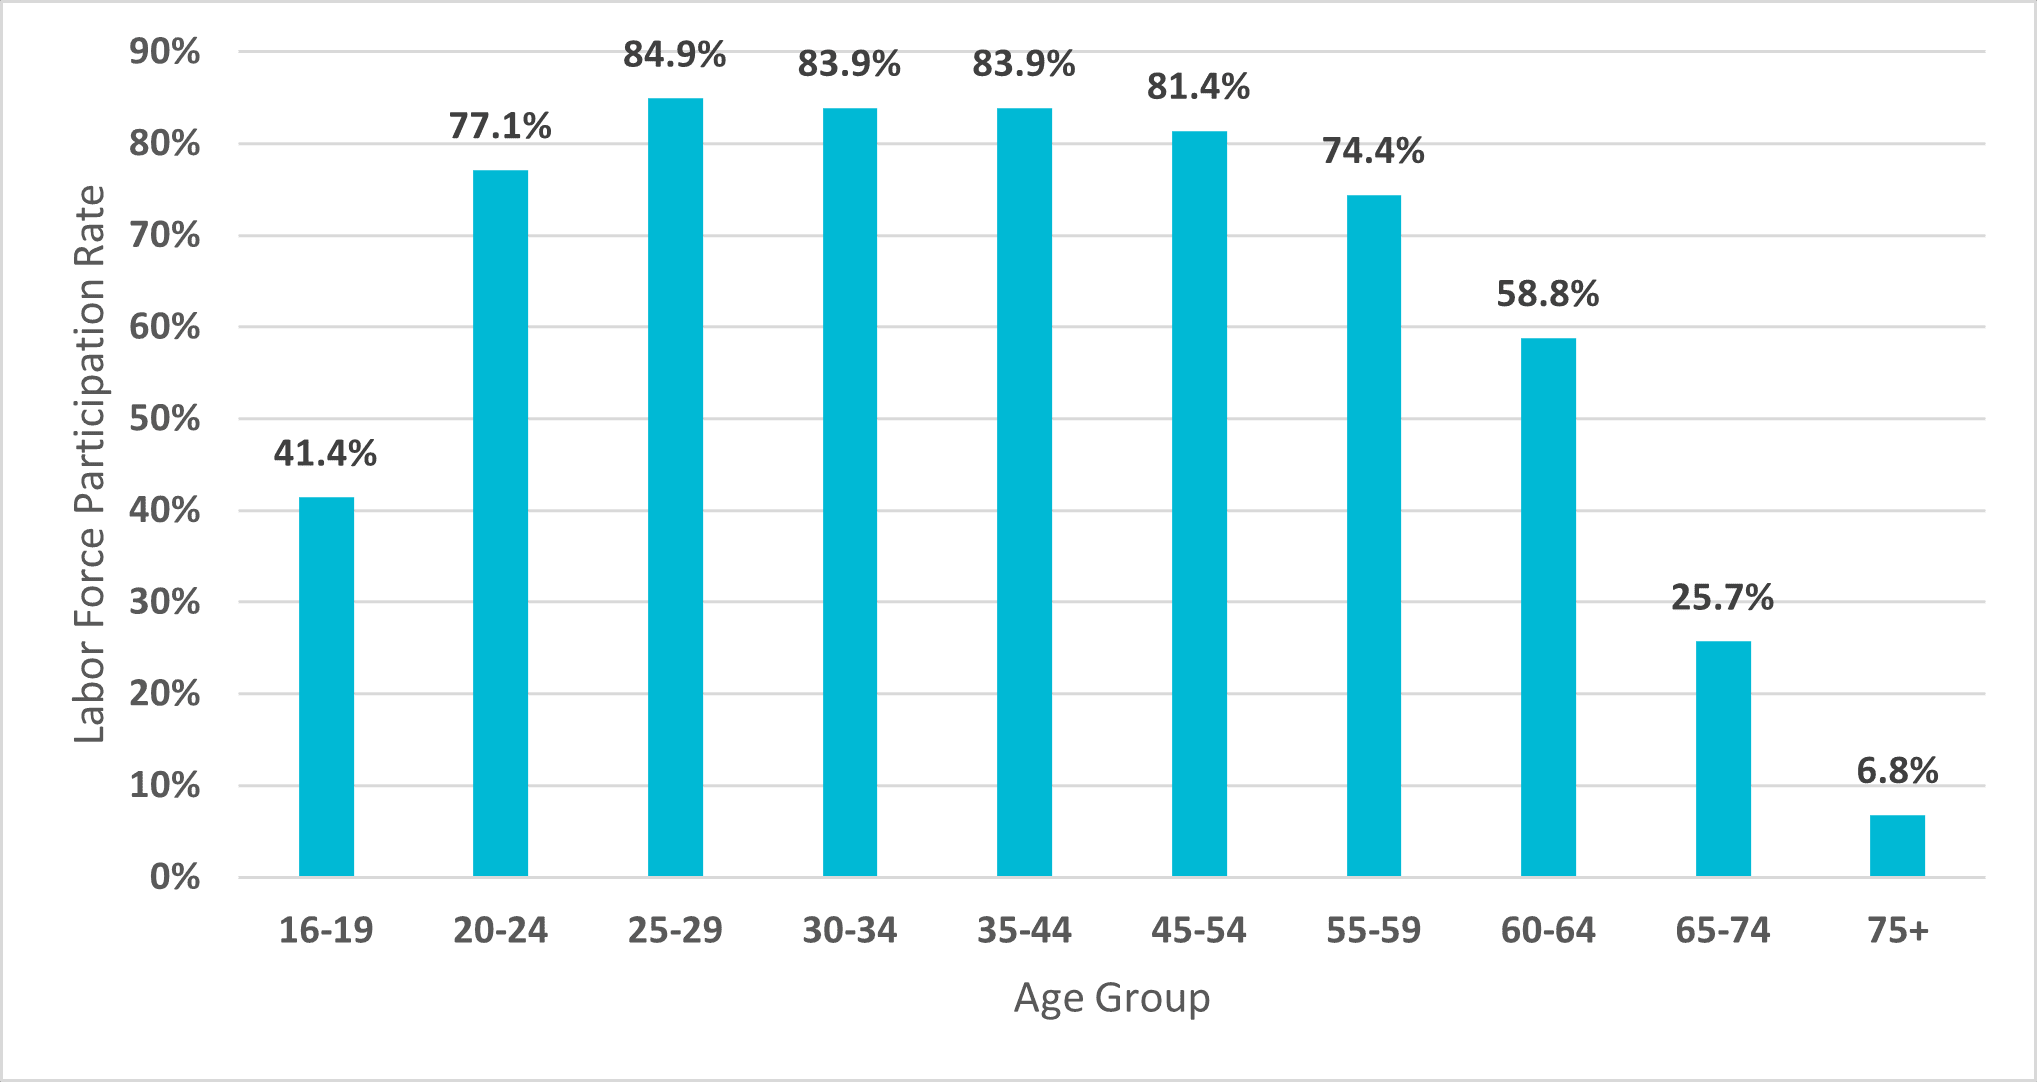
Source: US Census Bureau, American Community Survey, 1-Year Estimates
The business landscape is complex. Need help? Contact DMJPS.
For a printer-friendly version, click here.