Highlights:
DMJPS is pleased to provide a statewide quarterly economic report with highlights of North Carolina’s 15 metros for 2022 4th Quarter. The state of North Carolina continued a positive growth trend in the fourth quarter of 2022. In the mix of indicators, growth led to new peaks but also pointed to a slowdown in the pace. Employment growth was led by Raleigh, Wilmington, and Charlotte metros. The state’s fourth quarter unemployment rate was just slightly above the national average while the average number of unemployed dropped compared to a year earlier.
- In the fourth quarter of 2022, the state of North Carolina added an average of 160,600 net new jobs from one year earlier, earning an average growth rate of 3.4 percent. The state’s growth rate was on par with the national average which was also 3.4 percent but was slower than the third quarter’s 4.4 percent. Notably, monthly year-to-year job growth continued uninterrupted for twenty-one consecutive months.
- The state’s average unemployment rate at 3.5 percent for the quarter was just above the national average of 3.4 percent. At 3.0 percent each, Asheville and Durham-Chapel Hill shared the lowest unemployment rate among the state’s fifteen metros.
- Private industry average hourly wages in the state rose to $30.63 for a 5.8 percent gain from a year earlier. Durham-Chapel Hill led the state’s metros with a quarterly average of $34.17.
- The state’s same-home annual appreciation rate in the fourth quarter averaged 17.0 percent from a year ago, which was down compared to the previous five quarters.
- Taxable retail sales in North Carolina totaled $59.3 billion in the fourth quarter setting a record looking back four years.
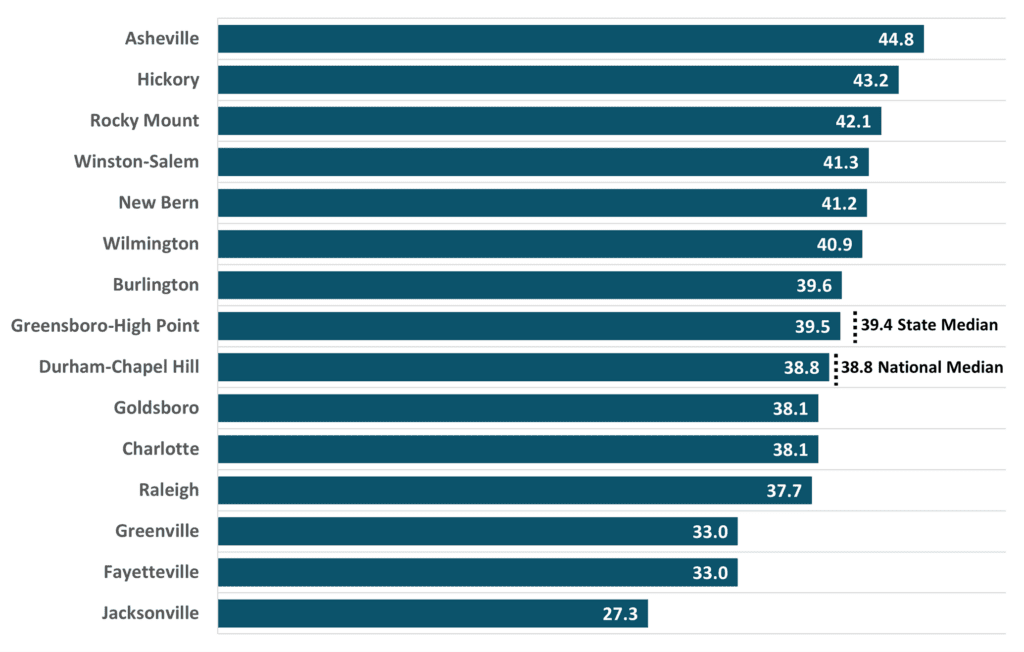
- Special feature: median age: North Carolina’s 2021 median age rose from 38.7 to 39.4 in the most recent five-year period. The state’s median age was greater than the national median of 38.8. The Asheville Metro’s median age of 44.8 was the highest among the state’s fifteen metros.
Detailed Analysis
Employment
In the fourth quarter of 2022, the state of North Carolina experienced positive employment gains and added an average of 160,600 net new jobs from one year earlier for an average growth rate of 3.4 percent (Figure 1). Although the rate slowed somewhat in the fourth quarter, positive monthly year-over-year job growth continued uninterrupted for twenty-one consecutive months. Employment averaged 4,886,333 employees over the fourth quarter, representing the highest quarterly average dating back to 1993. North Carolina’s growth rate was on par with the national growth rate which was also 3.4 percent.
Figure 1
North Carolina Total Employment
Monthly Year-to-Year
Percent Change

Source: US Bureau of Labor Statistics
Each of the fifteen metros in North Carolina gained employment in the fourth quarter of 2022 compared to a year earlier with two exceptions: Goldsboro and Rocky Mount (Figure 2). The state’s fastest growing metros were Raleigh (5.0 percent), Wilmington (4.4 percent), and Charlotte (3.6 percent). These three metros outpaced both the state and national growth rates in the fourth quarter.
Figure 2
2022 4Q Average
North Carolina Metros
Employment One-Year Percent Change

Source: US Bureau of Labor Statistics
Averaging 3.5 percent over the fourth quarter of 2022, North Carolina’s unemployment rate was slightly above the national average of 3.4 percent (Figure 3). The state’s unemployment rate translated into approximately 179,900 residents looking for employment which was a decline of 6.9 percent compared to a year earlier.
Asheville and Durham-Chapel Hill metros had the lowest fourth quarter unemployment rates, each at 3.0 percent (Figure 4). Rocky Mount and Fayetteville metros exceeded five percent, averaging 5.8 and 5.3 percent, respectively.
Figure 3
North Carolina
Unemployment Rate (%)

Source: US Bureau of Labor Statistics
Figure 4
North Carolina Metros
Unemployment Rate (%)
2022 4Q Average

Source: US Bureau of Labor Statistics
Eleven of thirteen major industry sectors in North Carolina gained employment in the fourth quarter of 2022 when compared to one year earlier (Figure 5). Professional and Business Services led with a net gain of 37,300 jobs. Leisure and Hospitality followed closely with a gain of 36,600 jobs while Private Education and Health Services added 20,800 jobs. Collectively, these three major industries made up 59 percent of the state’s overall fourth quarter year-to-year gains.
Figure 5
North Carolina – 2022 4Q
Major Industry Employment
One-Year Change

Totals rounded to nearest 100
Source: US Bureau of Labor Statistics
Wages
Private industry average hourly wages in North Carolina equaled $30.63 in the fourth quarter of 2022, a high point looking back as far as 2007. While the average hourly wage underwent a 5.8 percent gain from a year earlier, a slowdown was experienced following the first quarter of 2022 and the pace was slower than the preceding five quarters (Figure 6).
Two of the state’s metros held an average hourly wage above both the state and national averages (Figure 7), Durham-Chapel Hill at $34.17 and Charlotte at $33.31. Raleigh metro at $32.42 and Greenville metro at $30.73 exceeded the overall state average but trailed the national average.
Figure 6
North Carolina
Average Hourly Wages
Private Industry

Source: US Bureau of Labor Statistics
Figure 7
North Carolina Metros – 2022 4Q
Average Hourly Wages
Private Industry

Source: US Bureau of Labor Statistics
Housing
At 17.0 percent, the state of North Carolina’s same-home annual appreciation rate in the fourth quarter surpassed the national rate of 11.8 percent in 2022 (Figure 8). After reaching a high point of 26.9 percent in the second quarter of 2022, the state’s appreciation rate dropped in both the third and fourth quarters. Nine of the state’s fifteen metros surpassed the state’s fourth quarter average and all of the state metros surpassed the national average.
Figure 8
North Carolina Metros
Same-Home Annual Appreciation Rate (%)
2022 4Q

Source: Federal Reserve Bank of St. Louis
Estimated permit activity for new residential building in the state of North Carolina totaled 19,119 units in the fourth quarter of 2022 with a value of $4,289,875,000 (Figure 9). In percentage terms, the total number of units permitted in North Carolina was down 13.9 percent from one year earlier while the total value was down 9.9 percent. Multi-family accounted for 6,974 units or 36.5 percent of all residential units issued in the quarter, steadily increasing over the four quarters in 2022.
Figure 9
North Carolina
Estimated Residential Building Permits Activity*
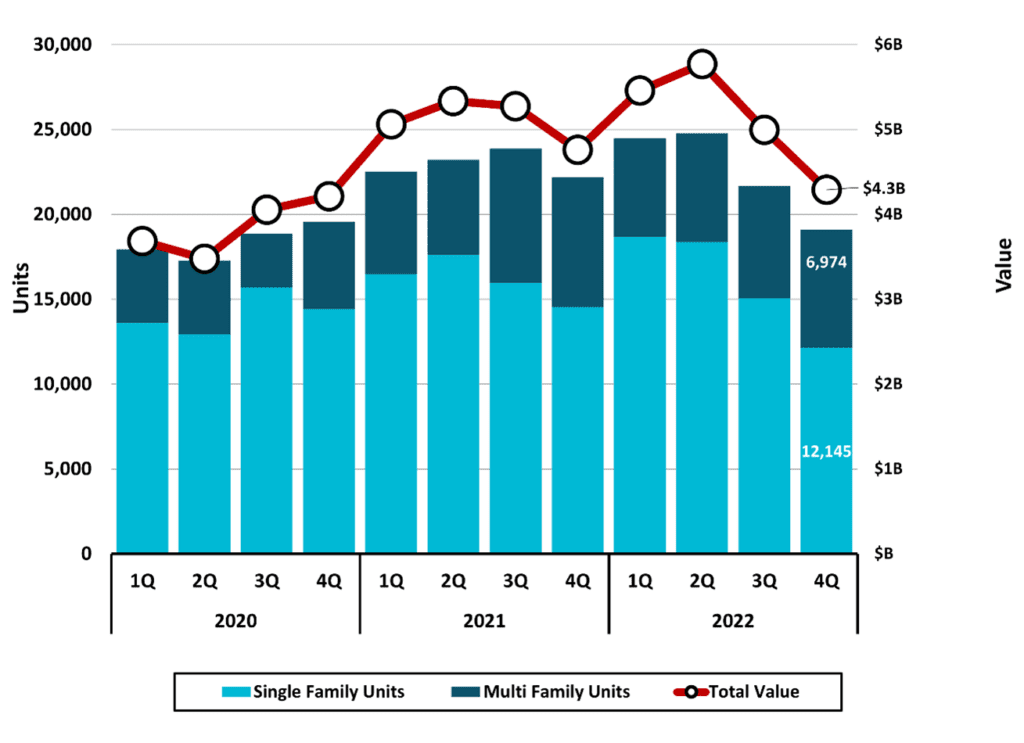
*Based on a survey of permitting agencies. The Census Bureau provides estimates for any missing agency data, which typically amounts to less than 20% of the total permits.
Source: US Census Bureau
Retail Sales
Taxable retail sales in North Carolina totaled $59,339,816,088 ($59.3 billion) in the fourth quarter of 2022, the highest sales figure in the 2020 – 2022 time period (Figure 10). This represented an 8.4 percent increase compared to a year earlier but was a slower pace compared to the previous eight quarters (Figure 11).
Figure 10
North Carolina
Total Taxable Retail Sales
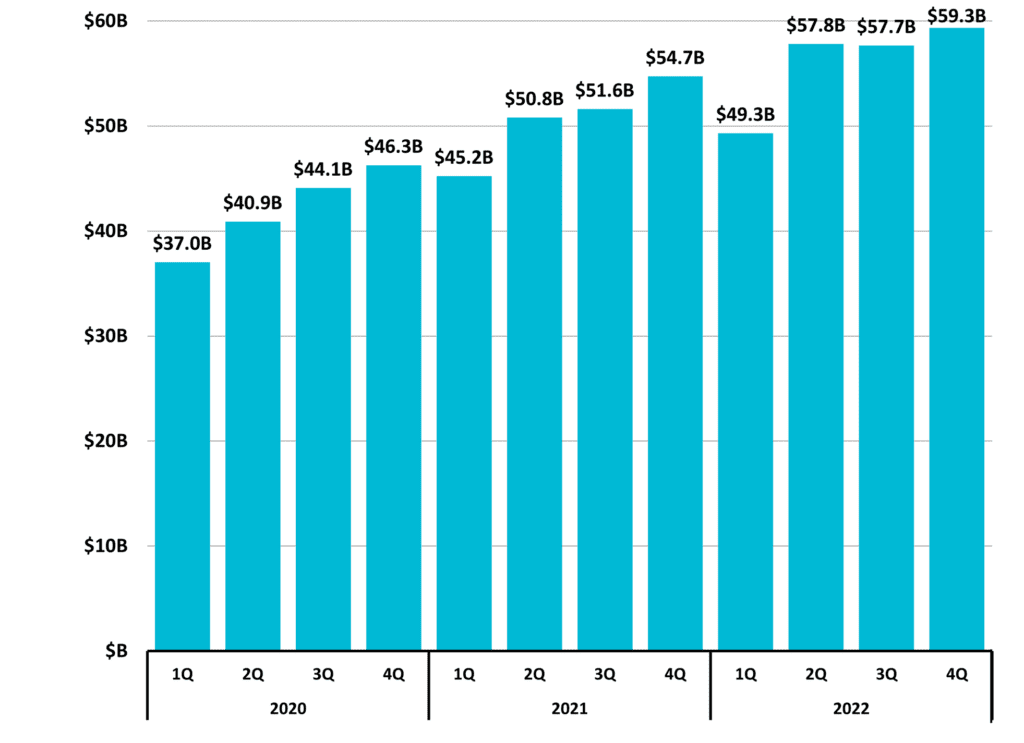
Includes collections of penalties, interest, and sales & use tax; and may reflect activity from prior periods.
Source: NC Department of Revenue
Figure 11
North Carolina
Total Taxable Retail Sales
Quarterly Year-to-Year Change (%)
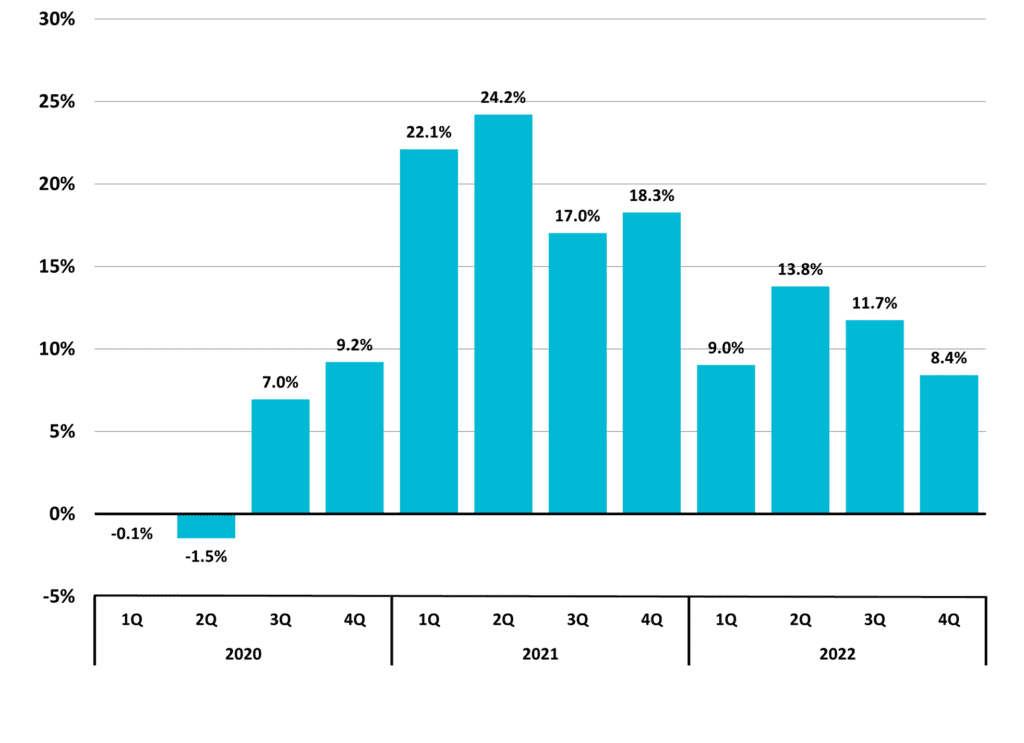
Includes collections of penalties, interest, and sales & use tax; and may reflect activity from prior periods.
Source: NC Department of Revenue
Special Feature:
Median Age
In 2021, the median age in North Carolina was 39.4 (Figure 12). This was up from a median of 38.7 five years prior. The state’s median age was greater than the overall national median of 38.8. Among the state’s fifteen metros, Asheville had the oldest median age of 44.8 while Jacksonville had the youngest at 27.3. Each of the state’s metros experienced an increase in median age compared to five years prior with the exception of the Burlington metro.
Figure 12
North Carolina Metros
Median Age, 2021
Source: US Census Bureau, 5-year Estimates (2017-2021)
Source: US Census Bureau
Need help navigating your business? Contact DMJPS.
For a printer-friendly version, click here.
End note: Data in this report reflects a snapshot or point in time, March 2023, and may be subject to periodic adjustment.