Highlights:
DMJPS is pleased to provide a statewide quarterly economic report with highlights of North Carolina’s fifteen metros for the second quarter of 2024. The state’s economic indicators suggest overall steady growth and reflect an adaptable economy.
- In the second quarter of 2024, North Carolina added approximately 72,200 jobs year-over-year, bringing the quarterly average to over 5.0 million employees – its highest average to date. By major industry, employment gains were led by Education and Health Services.
- The Raleigh metro led employment growth in the second quarter with a 2.5 percent increase compared to the previous year.
- North Carolina’s second-quarter average unemployment rate of 3.6 percent was lower than the national rate of 3.8 percent, although there was a rise in the number of unemployed compared to the prior year.
- Among the state’s fifteen metros, Asheville had the lowest second-quarter unemployment rate at 3.0 percent while Rocky Mount had the highest at 4.9 percent.
- The second quarter average hourly wage in North Carolina rose to $32.30, currently a record high of any quarter dating back to 2007.
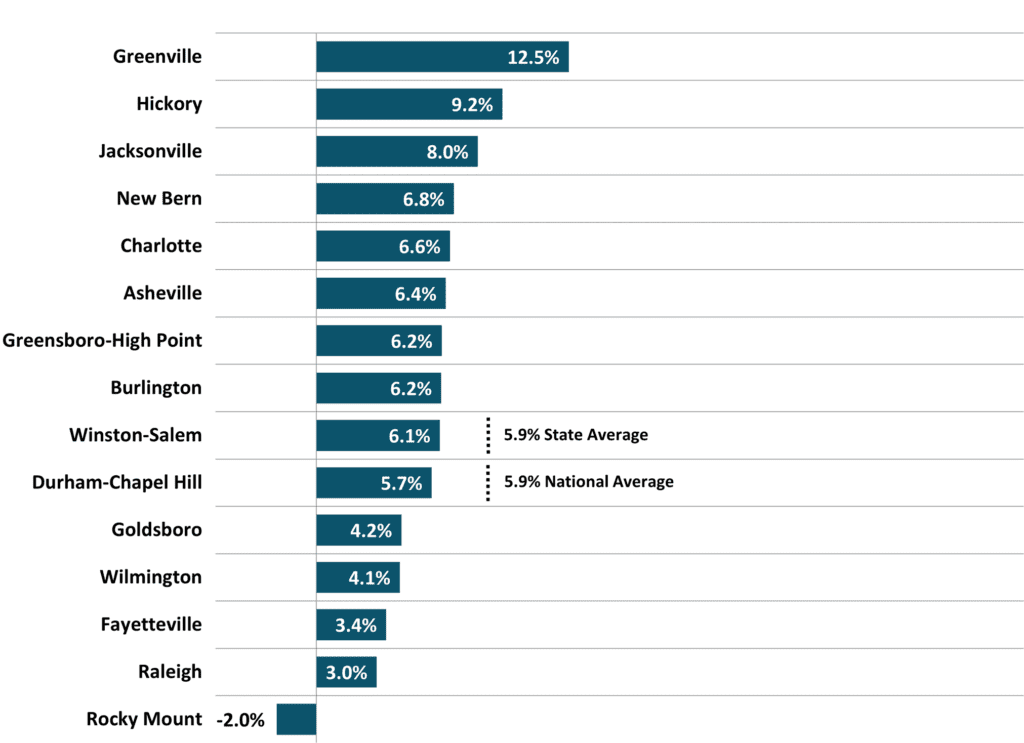
- At 5.9 percent, North Carolina’s same-home annual appreciation rate in the second quarter aligned with the national average. Greenville led the state metros with a 12.5 percent appreciation rate.
- Residential building permit activity established a quarterly high mark looking as far back as 2020 with nearly 25,700 permits in the second quarter of 2024.
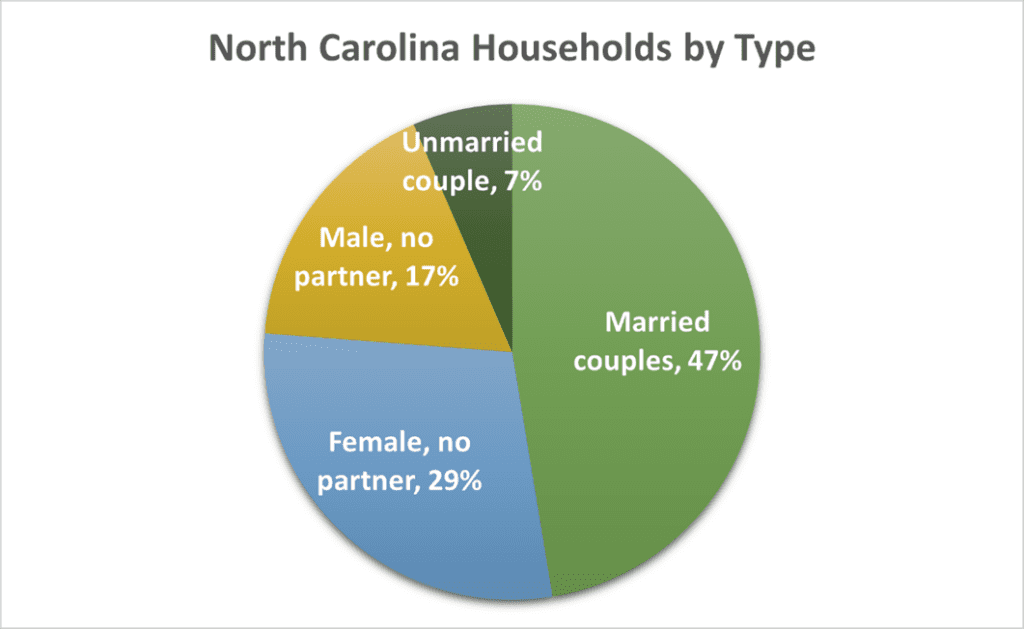
- Special feature, Households by Type: According to the U.S. Census Bureau, North Carolina had an estimated 4.4 million households in 2023, and married couple households made up 47 percent, whereas male and female households with no spouse or partner made up 46 percent.
Detailed Analysis:
Employment
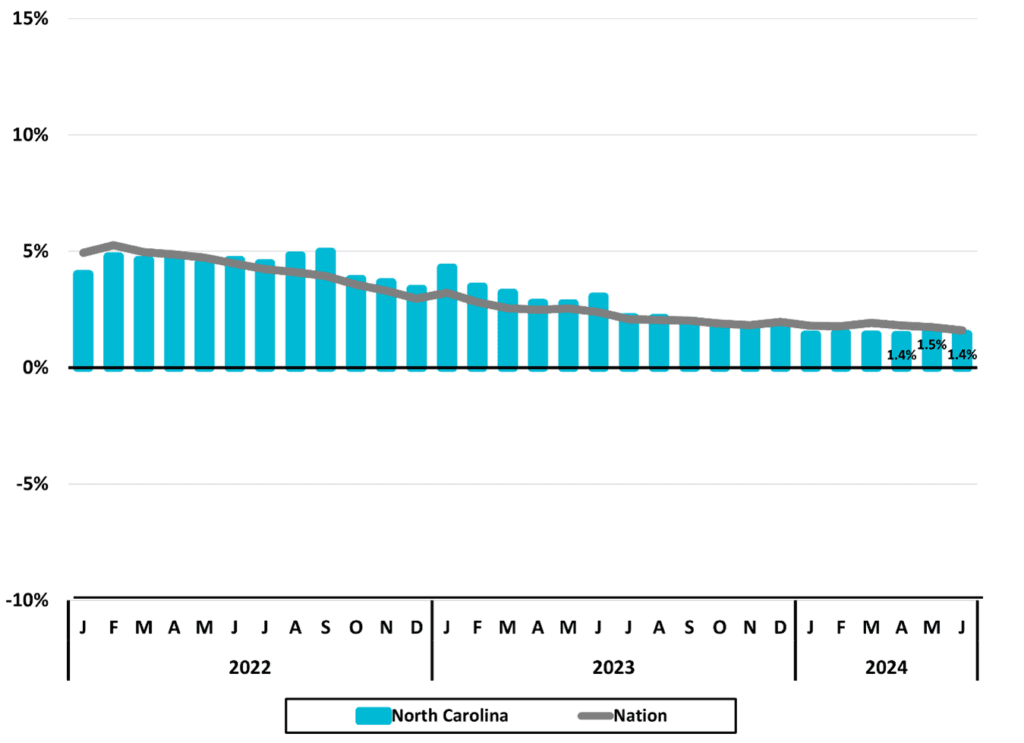
In the second quarter of 2024, North Carolina’s employment averaged 5,020,333, currently the highest quarterly average on record and the first time the state’s quarterly average surpassed the five million employee mark. Job growth has remained relatively steady, with a 1.5 percent year-over-year increase, slightly below the national average of 1.7% (Figure 1).
Figure 1
North Carolina Total Employment
Monthly Year-to-Year
Percent Change
 Source: US Bureau of Labor Statistics
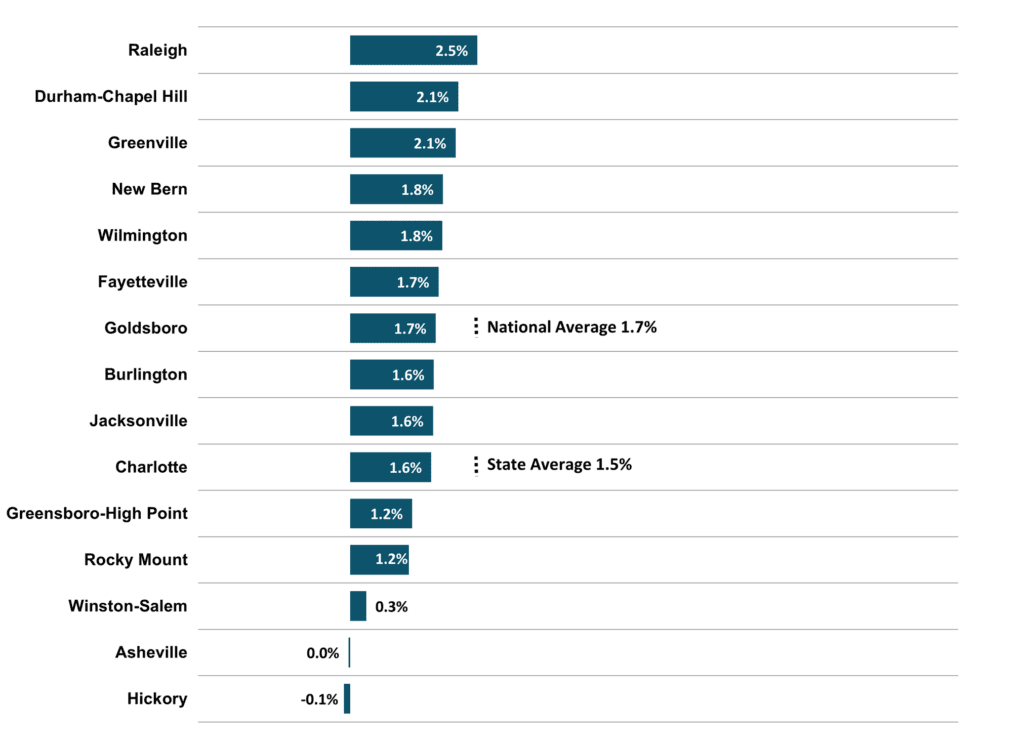
Raleigh was North Carolina’s fastest-growing metro in the second quarter of 2024 with a 2.5% employment increase compared to the previous year (Figure 2). The Durham-Chapel Hill and Greenville metros followed, each with a 2.1% increase. These three of the state’s fifteen metros experienced year-over-year employment gains exceeding 2%. The Winston-Salem, Asheville, and Hickory metros saw minimal change in employment.
Figure 2
2024 2Q Average
North Carolina Metros
Employment One-Year Percent Change
 Source: US Bureau of Labor Statistics
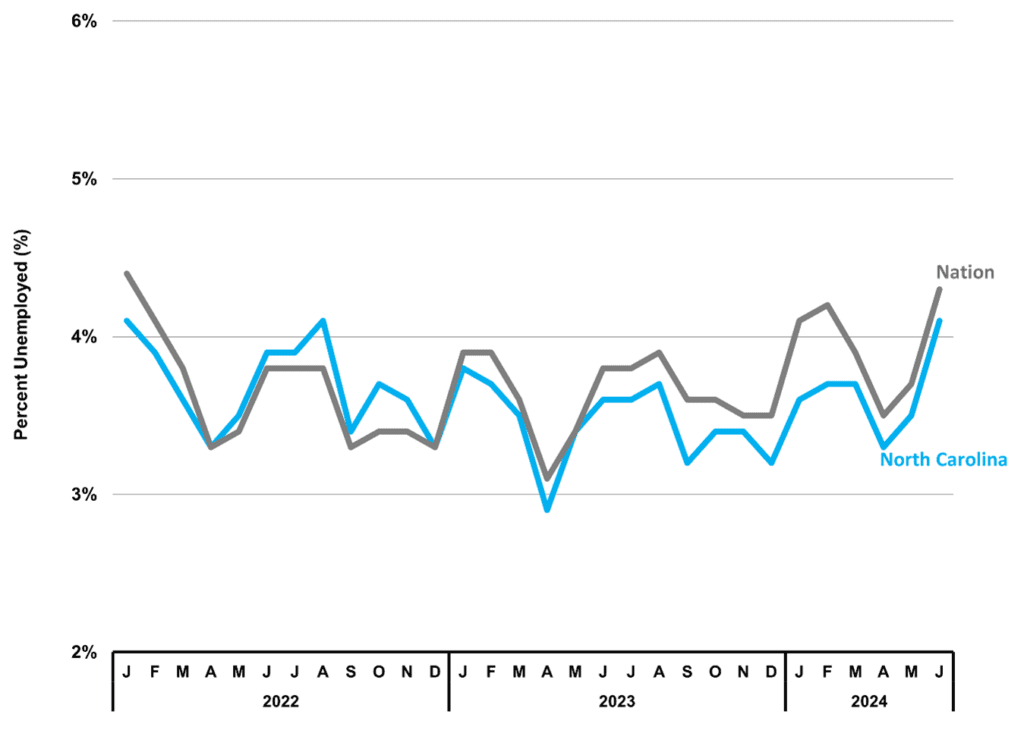
North Carolina’s unemployment rate averaged 3.6% in the second quarter of 2024, lower than the national rate of 3.8% (Figure 3). This marked the sixth consecutive quarter where the state’s rate was below the national average. In the second quarter of 2024, an average of 191,320 people in North Carolina were unemployed, actively seeking, and available to work. This represented a 10.6% increase from the previous year, reflecting a moderate rise in the number of unemployed individuals.
Figure 3
North Carolina
Unemployment Rates (%)
Source: US Bureau of Labor Statistics
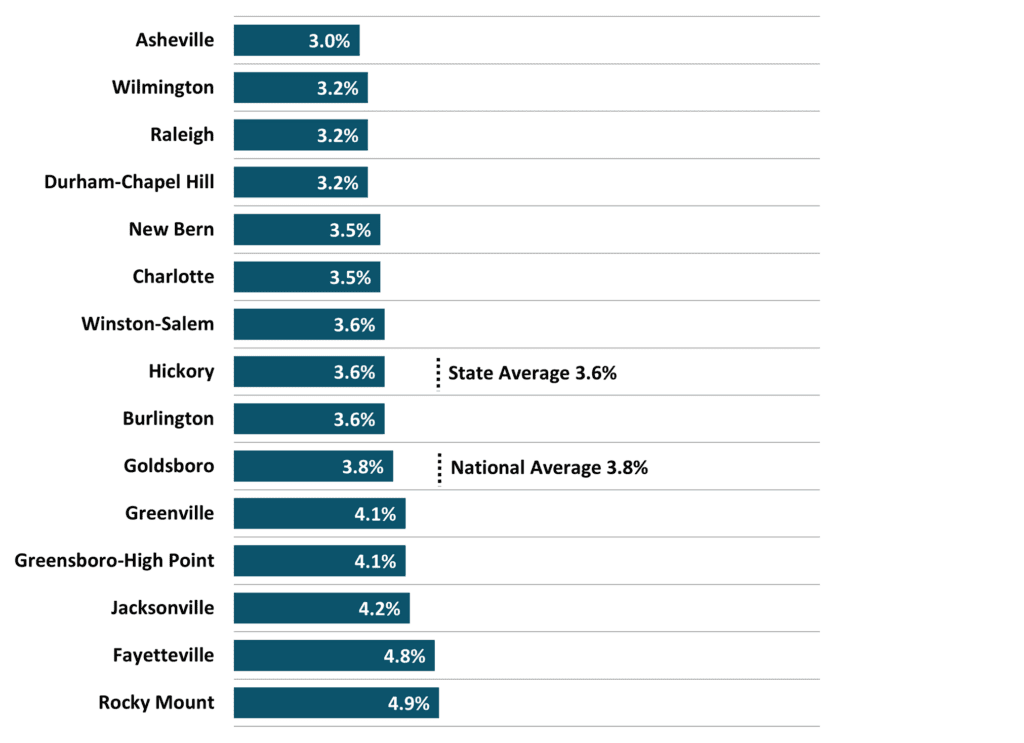
The Asheville metro had the lowest average unemployment rate at 3.0 percent in the second quarter of 2024 (Figure 4). This was followed by Wilmington, Raleigh, and Durham-Chapel Hill metros at 3.2 percent each. Six of North Carolina’s fifteen metros had average unemployment rates that were lower than the state’s 3.6 percent. Only five metros had rates exceeding 4.0 percent in the second quarter.
Figure 4
North Carolina Metros
Unemployment Rate (%)
2024 2Q Average
 Source: NC Department of Commerce
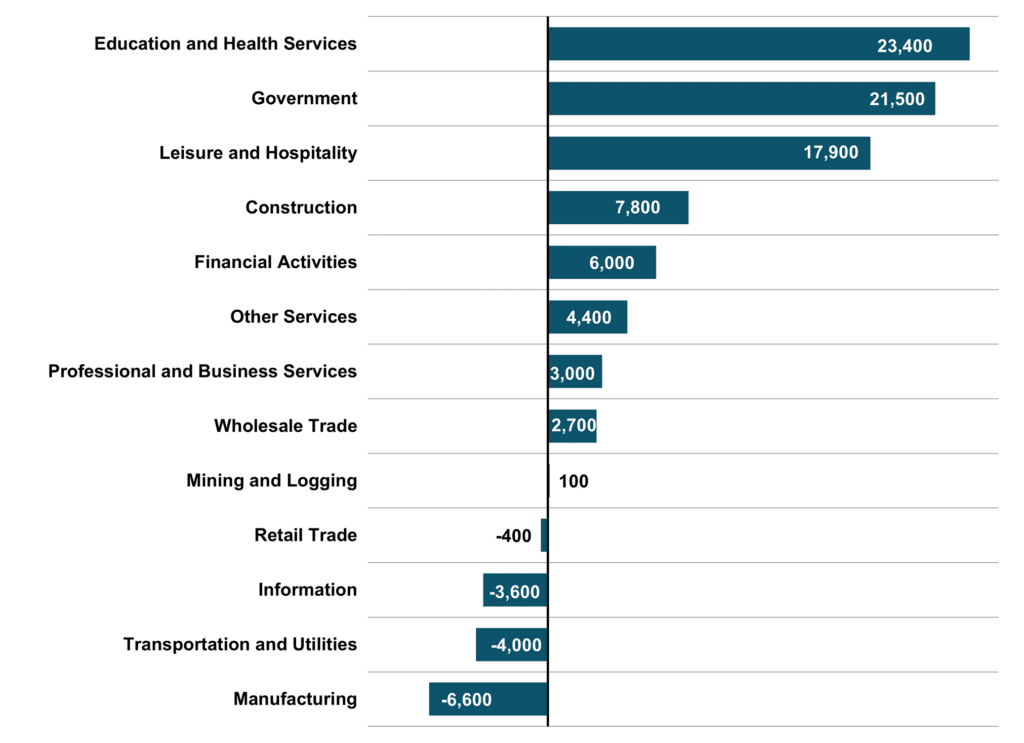
North Carolina had an overall gain of approximately 72,200 new jobs in the second quarter of 2024 compared to the prior year (Figure 5). Gains were led by Education and Health Services with 23,400 net new jobs. Government followed with 21,500 new jobs. Manufacturing experienced a loss of 6,600 jobs year-over-year, marking five consecutive quarters with year-over-year job loss. Although Retail Trade saw a quarterly loss of 400 jobs, this was a significant improvement from the 1,300 jobs lost in the first quarter year-over-year.
North Carolina has added new jobs each quarter on a year-over-year basis for 13 consecutive quarters, beginning in the second quarter of 2021.
Figure 5
North Carolina – 2024 2Q
Major Industry Employment
One-Year Change
 Totals rounded to nearest 100.
Source: US Bureau of Labor Statistics
Wages
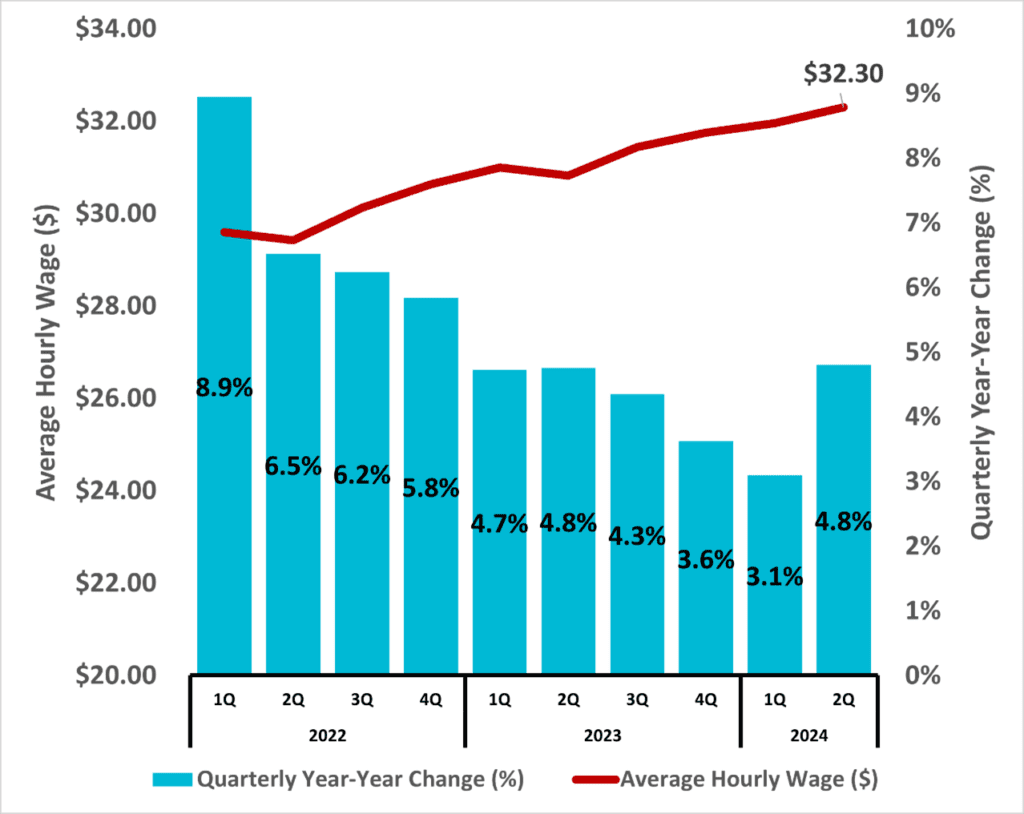
Private industry average hourly wages in North Carolina rose to $32.30 in the second quarter of 2024, currently the highest quarterly average dating back to 2007 (Figure 6). This represented a 4.8 percent increase compared to the prior year. The second quarter year-over-year growth rate outpaced the previous five quarters.
Figure 6
North Carolina
Average Hourly Wages
Private Industry
 Source: NC Department of Commerce
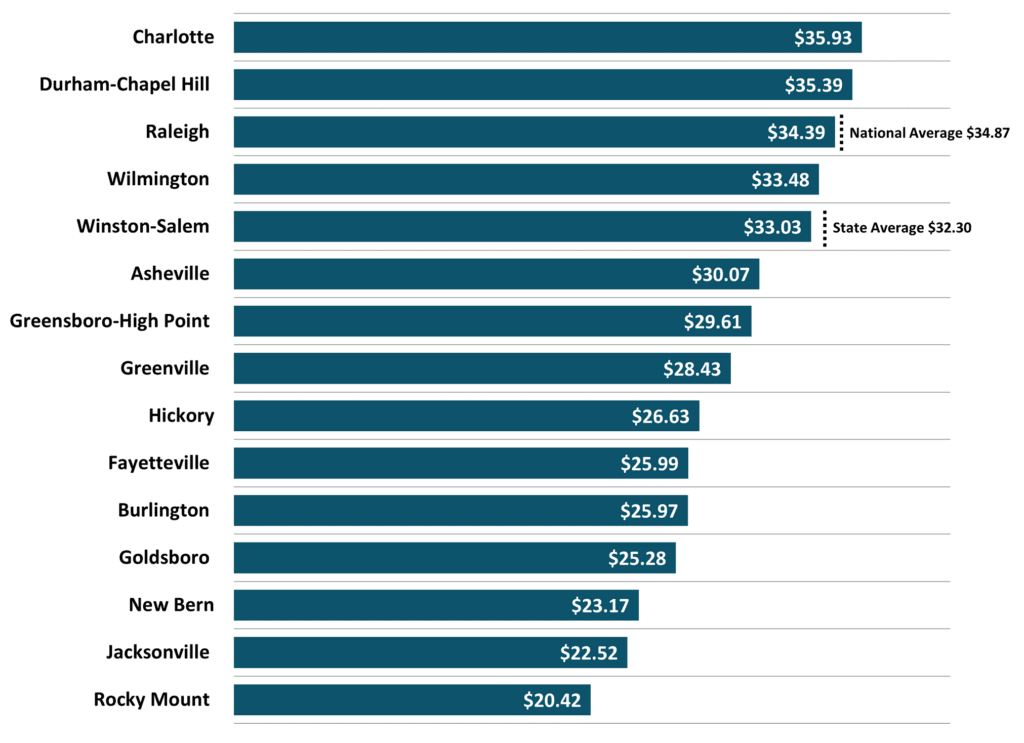
Charlotte led the state’s fifteen metro areas with an average hourly wage of $35.93 in the second quarter of 2024, the highest quarterly average for the metro dating back to 2007 (Figure 7). Durham-Chapel Hill followed at $35.39, though this marked a decline compared to the first quarter of 2024. Each metro in the state saw wage increases from the first quarter of 2024, except for Durham-Chapel Hill, Wilmington, Hickory, Goldsboro, and New Bern. Five of the fifteen metros exceeded the state average of $32.30, with Charlotte and Durham-Chapel Hill also surpassing the national average of $34.87.
Figure 7
North Carolina Metros – 2024 2Q
Average Hourly Wages
Private Industry
 Source: NC Department of Commerce
Housing
North Carolina’s same-home annual appreciation rate stood at 5.9 percent in the second quarter, matching the national rate (Figure 8). Greenville led the state’s metros with a 12.5 percent appreciation rate and the majority of metros exceeded both the state and national averages. Rocky Mount was the only metro to experience a year-over-year decline in the second quarter.
Figure 8
North Carolina Metros
Same-Home Annual Appreciation Rate (%)
2024 2Q
 Source: Federal Reserve Bank of St. Louis
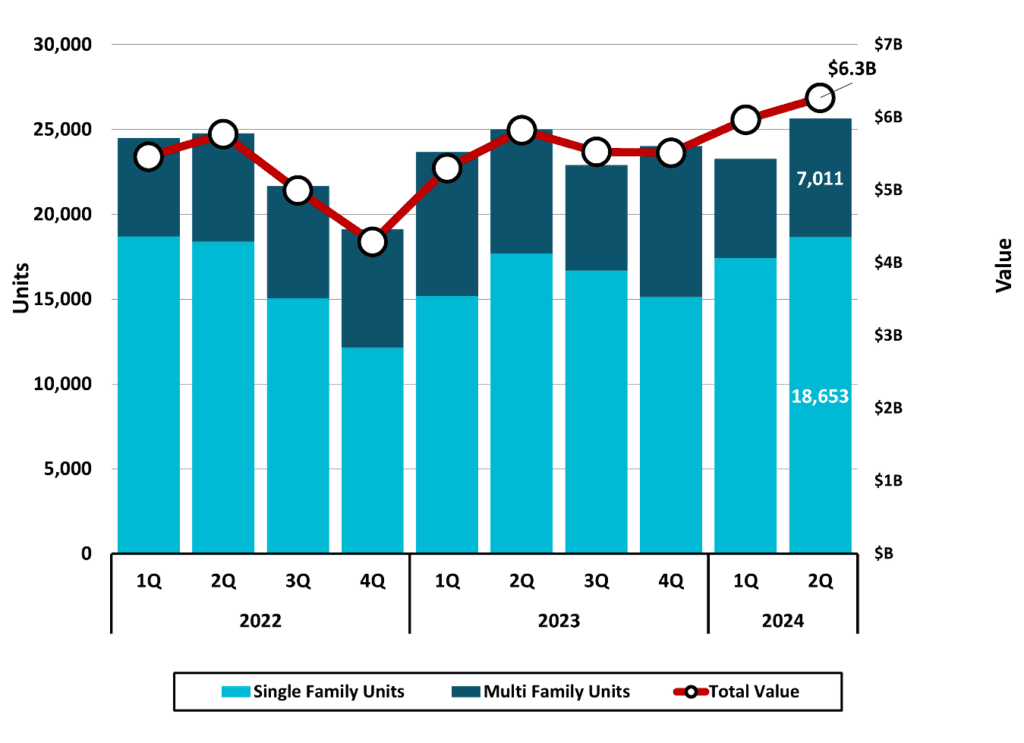
Permit activity for new residential building in North Carolina reached 25,664 units in the second quarter of 2024, marking the highest level looking as far back as 2020, with a total value of $6,270,656,000 (Figure 9). This represented a 2.7 percent increase in the number of units permitted compared to the previous year, and a 7.7 percent rise in total value. Multi-family units accounted for 7,011 permits, or 27.3 percent of units permitted.
Figure 9
North Carolina
Estimated Residential Building Permits Activity*
 *Based on a survey of permitting agencies. The Census Bureau provides estimates for
any missing agency data, which typically amounts to less than 20% of the total permits.
Source: US Census Bureau
Retail Sales
Taxable retail sales in North Carolina totaled $60,683,019,259 ($60.7 billion) in the second quarter of 2024, a 3.2 percent increase compared to the previous year (Figure 10 and Figure 11). This marked a five-year high for any second quarter and the second time the state surpassed $60 billion in any quarter looking as far back as 2019.
Figure 10
North Carolina
Total Taxable Retail Sales
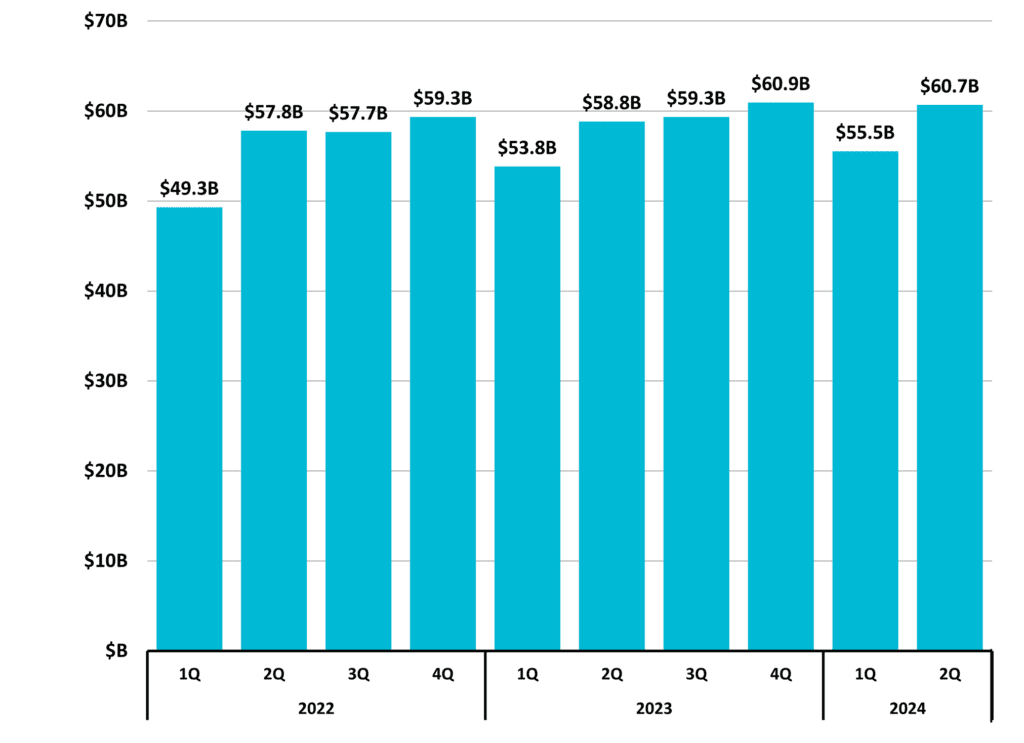 Includes collections of penalties, interest, and sales & use tax; and may reflect activity from prior periods.
Source: NC Department of Revenue
Figure 11
North Carolina
Total Taxable Retail Sales
Quarterly Year-to-Year Change (%)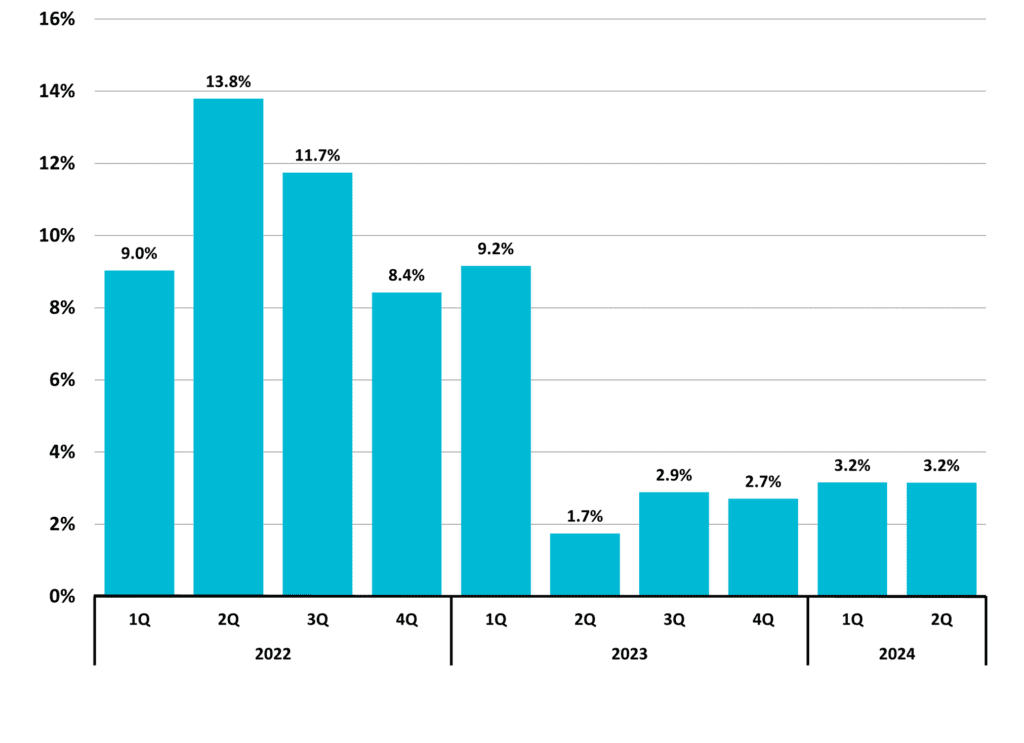 Includes collections of penalties, interest, and sales & use tax; and may reflect activity from prior periods.
Source: NC Department of Revenue
Special Feature:
Households by Type
In 2023, the U.S. Census Bureau estimated 4,392,669 households. Of these, 47% were married-couple households, 7% were cohabiting couples who were not married, 17% were male householders without a spouse or partner, and 29% were female householders without a spouse or partner (Figure 12). Additionally, 17% of households were married couples with children under 18 years of age.
Figure 12
North Carolina
Households by Type
 Source: US Census Bureau
The business landscape is complex. Need help? Contact DMJPS.
For a printer-friendly version, click here.