
Highlights:
DMJPS is pleased to provide the second quarter 2025 economic update across North Carolina’s fifteen metro areas. Despite signs of moderating growth in some indicators, the state’s economy continues to show steady expansion, marked by broad-based job gains, low unemployment rates, rising wages, and strong consumer spending. Population dynamics further reinforce North Carolina’s economic strengths, with a diverse age distribution supporting workforce depth and long-term growth.
- In the second quarter of 2025, North Carolina’s employment averaged 5,107,500 jobs for an increase of 75,800 new jobs year-over-year.
- Goldsboro, Charlotte, and Winston-Salem metros recorded the fastest year-over-year employment growth rates, each at 2.2 percent.
- By major industry, second-quarter employment gains continued to be led by Education and Health Services, with an estimated 20,700 new jobs added year-over-year.
- North Carolina’s unemployment rate averaged 3.7 percent in the second quarter, translating to roughly 194,357 unemployed North Carolinians, an increase of 5.4 percent compared to the previous year.
- Among the state’s fifteen metros, Rocky Mount posted the highest unemployment rate at 4.9 percent, while all metros remained below five percent.
- The state’s average hourly wage in the second quarter was $33.67, up 4.2 percent year-over-year, with Raleigh leading the metros at $36.63.
- Taxable retail sales in North Carolina totaled $63 billion in the second quarter, a robust 4.5 percent increase year-over-year.
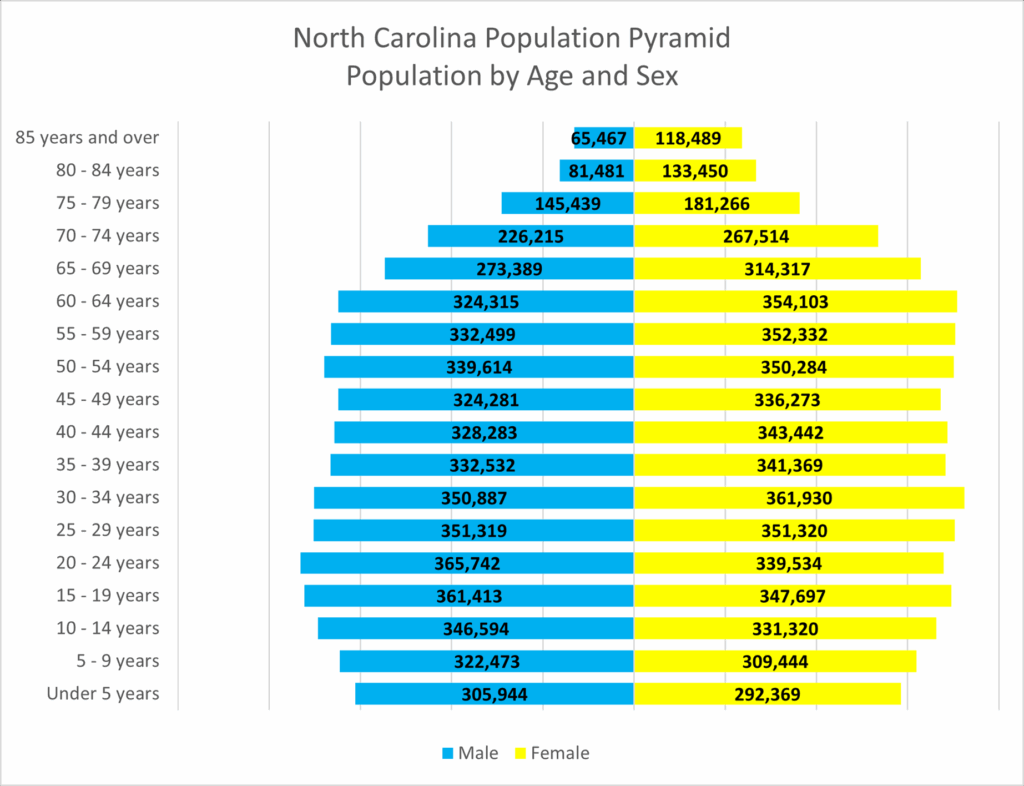
- Special feature: North Carolina Population Pyramid. In North Carolina, with a population of approximately 10.6 million in 2023, the population pyramid highlights a large share of young adults in their 20s, a sizable mid-career workforce, and notable numbers of residents aged 65 and above. These combined strengths support the career ladder across a broad spectrum.
Detailed Analysis:
Employment
North Carolina’s employment averaged 5,107,500 jobs in the second quarter of 2025, marking another record-high quarterly average. Employment grew 1.5 percent year-over-year, outpacing the national increase of 1.1 percent (Figure 1).
Figure 1
North Carolina Total Nonfarm Employment
Monthly Year-to-Year
Percent Change
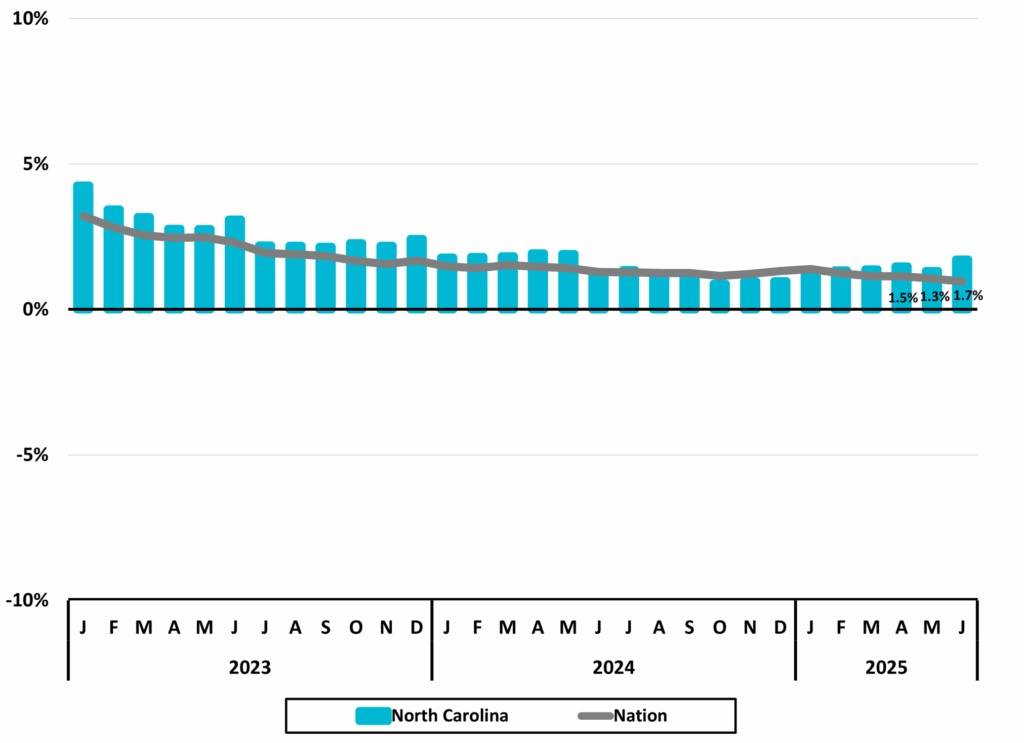 Source: US Bureau of Labor Statistics, All Employees, Total Nonfarm, retrieved from Federal Reserve Bank of St. Louis
Goldsboro, Charlotte, and Winston-Salem metros each posted the state’s fastest year-over-year employment growth at 2.2 percent (Figure 2). With the exception of Asheville — where recovery from Hurricane Helene continues — no metro lost jobs in the second quarter, though Fayetteville was unchanged. Four metros grew at a pace exceeding both the state and national averages while Durham-Chapel Hill effectively matched the statewide growth rate.
Figure 2
2025 2Q Average
North Carolina Metros
Employment One-Year Percent Change
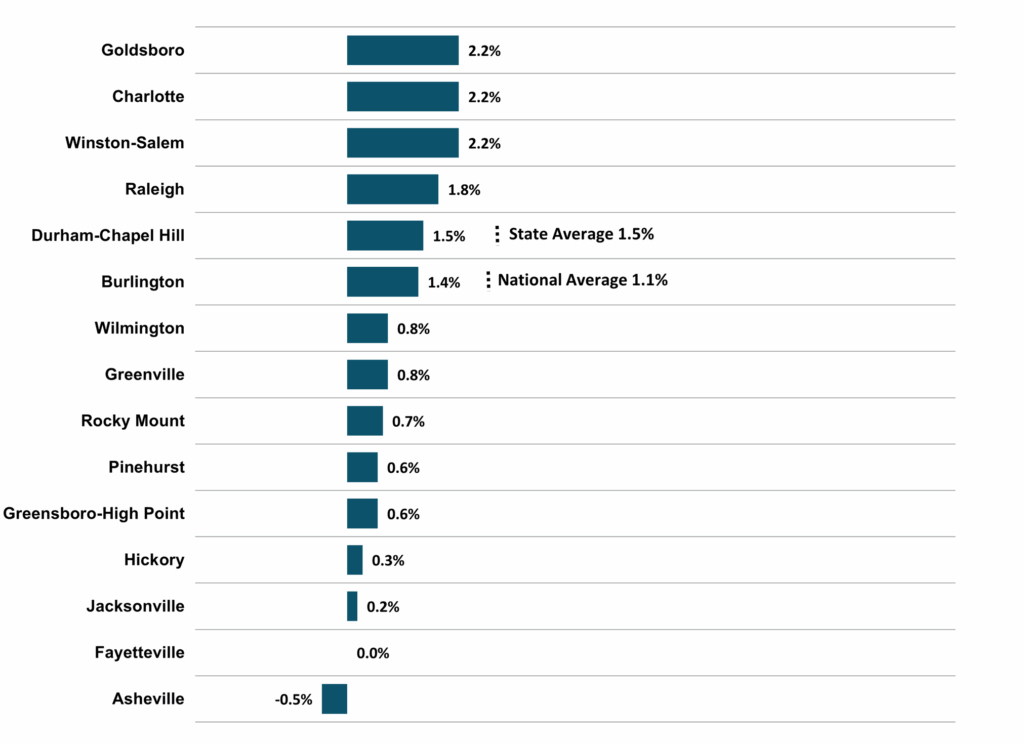 Source: US Bureau of Labor Statistics and Federal Reserve Bank of St. Louis, All Employees: Total Nonfarm by Metro, retrieved from Federal Reserve Bank of St. Louis
North Carolina’s unemployment rate averaged 3.7 percent in the second quarter of 2025, 0.4 percentage points below the national average of 4.1 percent (Figure 3). The state’s rate has now been lower than the national average for ten consecutive quarters and has remained under four percent since late 2021. Still, the rate reflects an average of 194,357 North Carolinians unemployed and available to work — a 5.4 percent increase from the same quarter a year earlier.
Figure 3
North Carolina
Unemployment Rates (%)
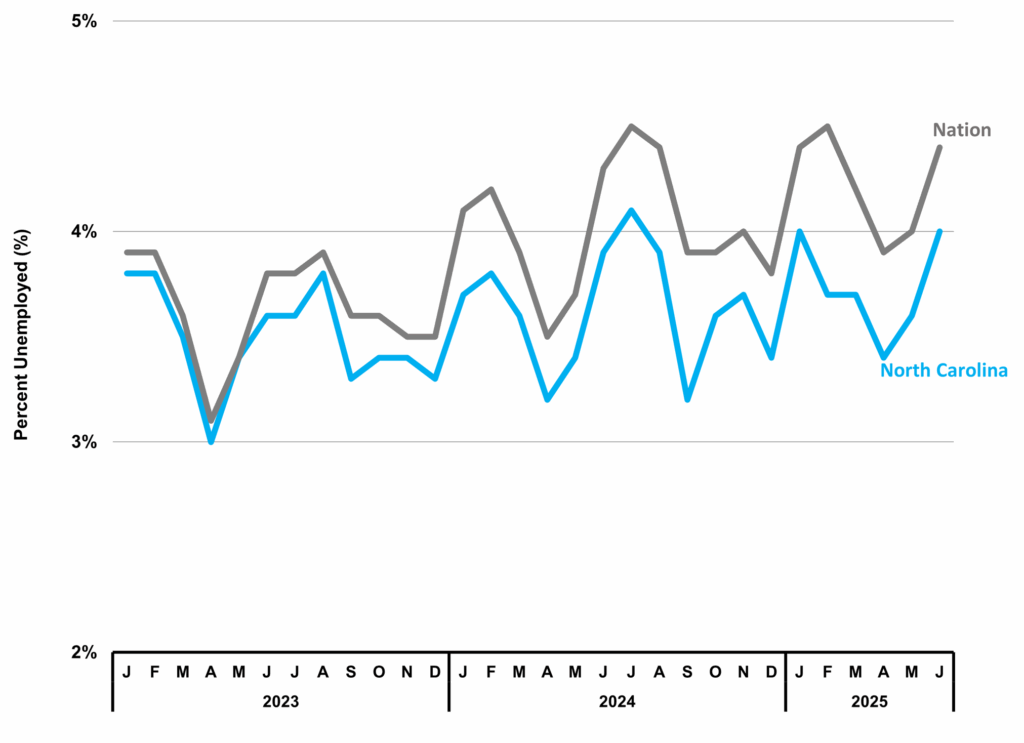
Source: US Bureau of Labor Statistics Unemployment Rate retrieved from Federal Reserve Bank of St. Louis; NC Department of Commerce
Among North Carolina’s fifteen metros, Raleigh (3.1 percent) and Durham–Chapel Hill (3.3 percent) recorded the lowest unemployment rates in the second quarter of 2025 (Figure 4). This continued a trend from the first quarter. Nine metros had unemployment rates at or below the state average of 3.7 percent. Five metros were at or above 4.0 percent and among these, Asheville (4.2 percent), Fayetteville (4.6 percent), and Rocky Mount (4.9 percent) each exceeded the national average of 4.1 percent.
Figure 4
North Carolina Metros
Unemployment Rate (%)
2025 2Q Average
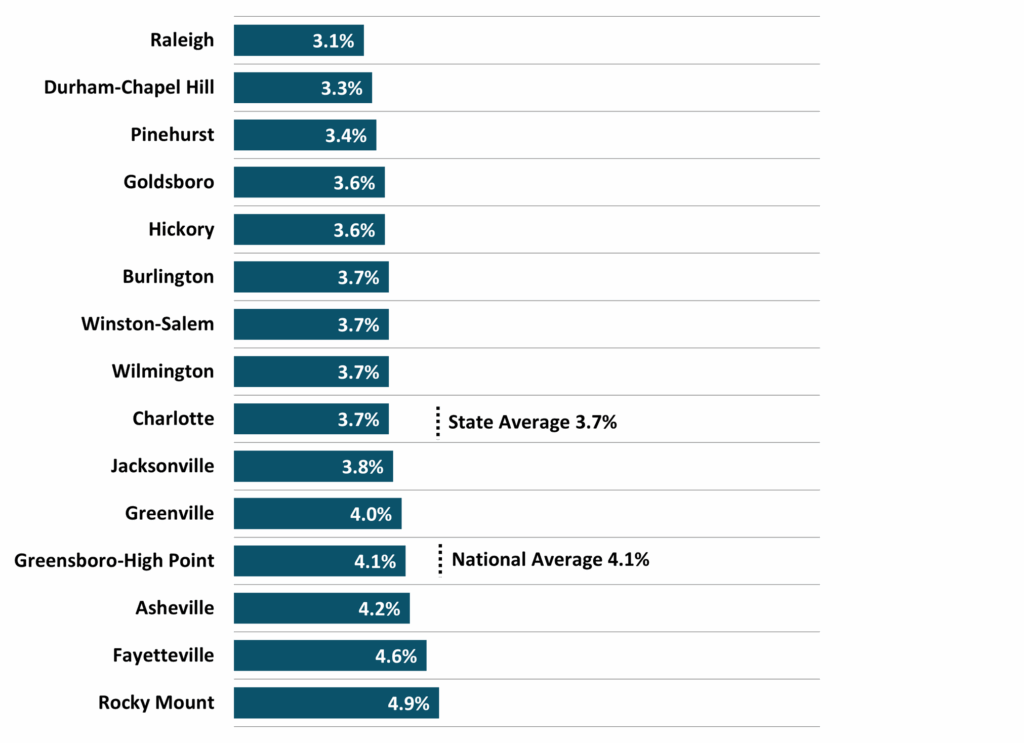 Source: US Bureau of Labor Statistics, Unemployment Rate by Metro, retrieved from Federal Reserve Bank of St. Louis
North Carolina added approximately 75,800 jobs in the second quarter of 2025 compared to the same quarter a year earlier (Figure 5). While this marked an improvement over the previous quarter, it remained below the year-over-year gain of 83,500 jobs in the second quarter of 2024.
Education and Health Services continued leading employment growth with 20,700 new jobs, followed by Professional and Business Services with a gain of 19,200. Only two major industries reported year-over-year losses. Manufacturing posted the largest decline, down 6,700 jobs, and has not recorded a year-over-year increase since the first quarter of 2023.
Figure 5
North Carolina – 2025 2Q
Major Industry Employment
One-Year Change
 Totals rounded to the nearest 100.
Source: US Bureau of Labor Statistics, All Employees by Major Industry in North Carolina, retrieved from Federal Reserve Bank of St. Louis
Wages
Average hourly wages in North Carolina rose to $33.67 in the second quarter of 2025, up 4.2 percent from a year earlier (Figure 6). Although the pace eased from 4.9 percent in the prior quarter, wages remain on a steady upward trajectory, with $33.67 marking a new high.
Figure 6
North Carolina
Average Hourly Wages
Private Industry
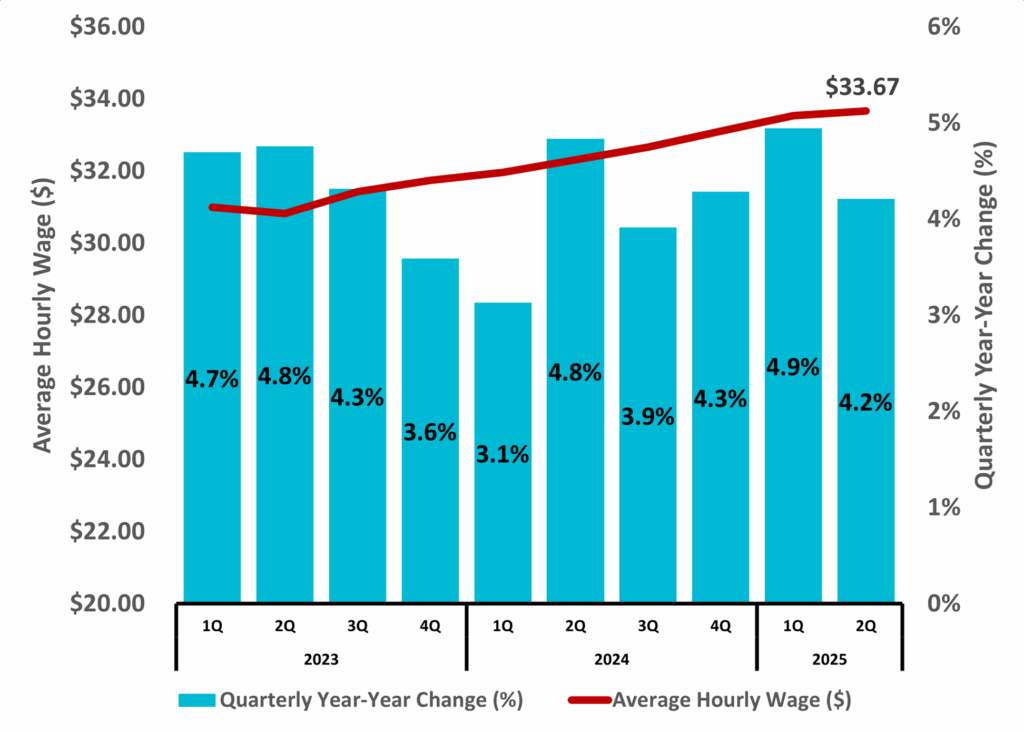 Source: US Bureau of Labor Statistics and Federal Reserve Bank of St. Louis, Average Hourly Earnings of All Employees: Total Private in North Carolina
Raleigh led North Carolina’s metros in the second quarter with an average hourly wage of $36.63, followed by Charlotte at $36.40 (Figure 7). These were the only metros exceeding both the state and national averages. Compared to the previous quarter, average hourly wages declined modestly in ten of the fifteen metros, while Raleigh, Asheville, Greenville, Pinehurst, and Jacksonville posted gains. Even with many metros seeing slight declines, the statewide average continued to rise overall.
Figure 7
North Carolina Metros – 2025 2Q
Average Hourly Wages
Private Industry
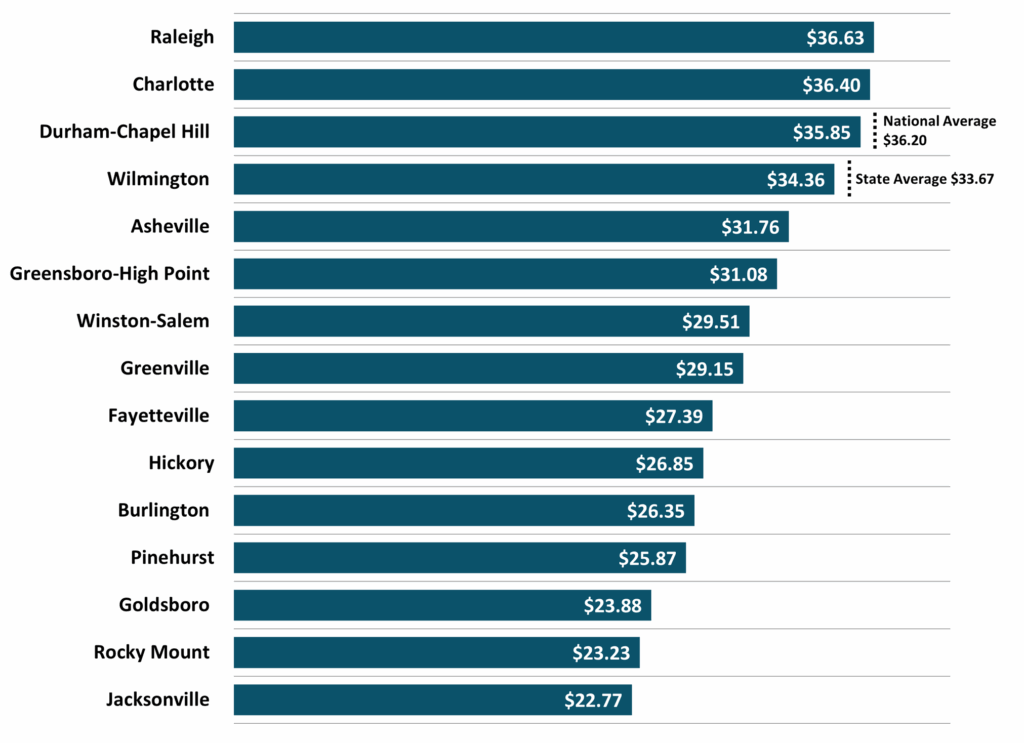 Source: US Bureau of Labor Statistics and Federal Reserve Bank of St. Louis, Average Hourly Earnings of All Employees: Total Private by Metro, retrieved from Federal Reserve Bank of St. Louis
Housing
North Carolina’s annual house price appreciation rate was 3.3 percent in the second quarter of 2025, below the national rate of 3.8 percent (Figure 8). Rocky Mount led the state’s metros with an 11.3 percent increase, while Greenville was the only metro to record a decline (-3.4 percent). Durham–Chapel Hill posted the slowest positive growth at 1.6 percent. Five metros exceeded both the state and national rates: Rocky Mount, Jacksonville, Pinehurst, Winston-Salem, and Greensboro–High Point.
Figure 8
North Carolina Metros
Annual Appreciation Rate (%)
2025 1Q
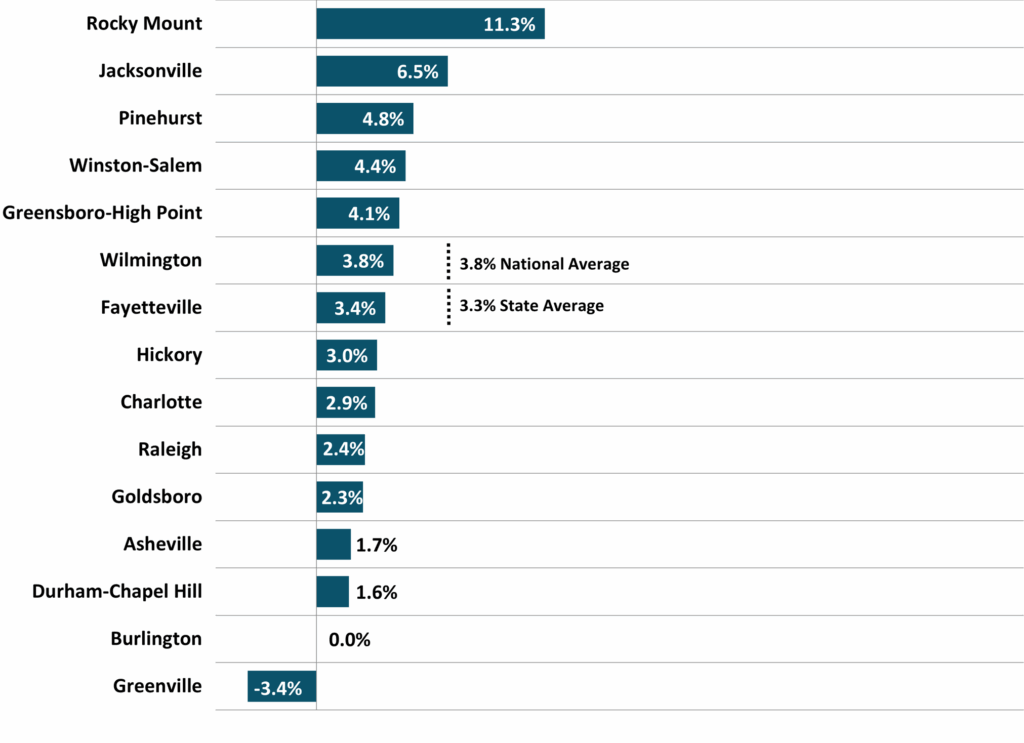 Source: US Federal Housing Finance Agency, All-Transactions House Price Index, retrieved from Federal Reserve Bank of St. Louis
Permit activity for new residential building in North Carolina totaled 22,049 units in the second quarter of 2025 with a value of $5,942,238,000 (Figure 9). This represented a decline of 14.1 percent in the number of units permitted year-over-year, while total value decreased by 5.2 percent. Multi-family units accounted for 4,406 permits, or approximately 20 percent of units permitted.
Figure 9
North Carolina
Estimated Residential Building Permits Activity*
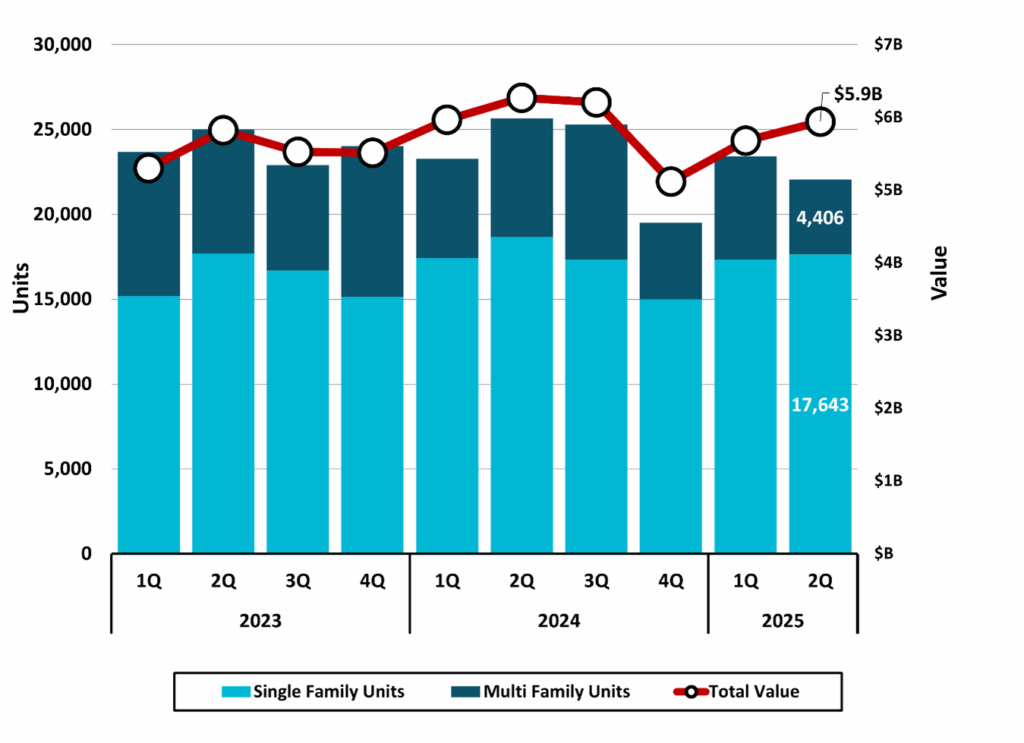 *Based on a survey of permitting agencies. The Census Bureau estimates
any missing agency data, which typically amounts to less than 20% of the total permits.
Source: US Census Bureau
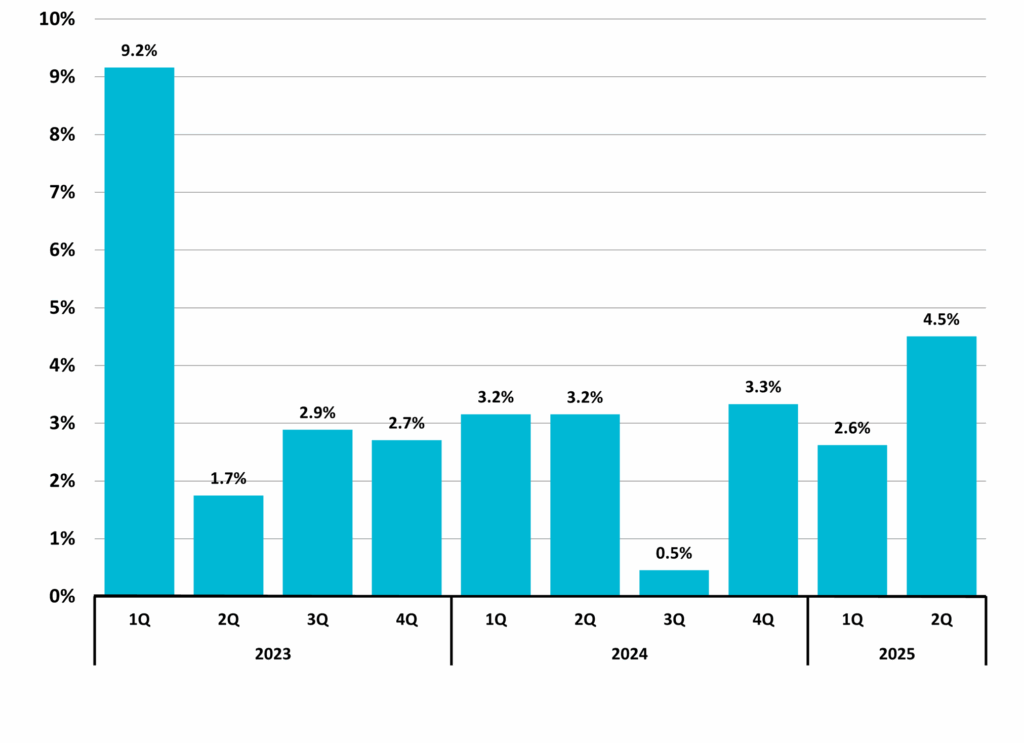
Retail Sales
Taxable retail sales in North Carolina totaled $63,414,876,433 ($63 billion) in the second quarter of 2025, marking a new quarterly high point (Figure 10). Year-over-year growth of 4.5 percent was the fastest pace since the first quarter of 2023 (Figure 11).
Figure 10
North Carolina
Total Taxable Retail Sales
 Includes collections of penalties, interest, and sales & use tax; and may reflect activity from prior periods.
Source: NC Department of Revenue
Figure 11
North Carolina
Total Taxable Retail Sales
Quarterly Year-to-Year Change (%)
 Includes collections of penalties, interest, and sales & use tax; and may reflect activity from prior periods.
Source: NC Department of Revenue
Special Feature:
North Carolina Population Pyramid
The U.S. Census Bureau’s 2023 estimates showed North Carolina’s population at approximately 10.6 million, with 48.8 percent male and 51.2 percent female (Figure 12). The population pyramid highlights a broad age distribution that reflects the state’s combined strengths: early-career talent advancing through the pipeline, a strong mid-career core, and the seasoned knowledge and economic contributions of experienced individuals in upper tiers. The pyramid reflects some variation in mid-career cohorts but maintains broad balance.
Figure 12
Uninsured Rate by State
Source: US Census Bureau, 2023 American Community Survey, 5-Year Estimates
Update on Metropolitan Statistical Area Delineation Changes:
The second quarter 2025 report reflects revisions to metropolitan statistical area delineations (MSAs or metros) in North Carolina, as defined by the Office of Management and Budget (OMB). These changes include the following:
• The New Bern metro has been redesignated as a Micropolitan Statistical Area.
• Moore County now constitutes the new Southern Pines–Pinehurst metro area.
• The Asheville metro no longer includes Haywood County and consists of Buncombe, Henderson, and Madison counties.
• Anson County has been added to the Charlotte-Concord-Gastonia metro area.
• Brunswick County has been added to the Wilmington metro area.
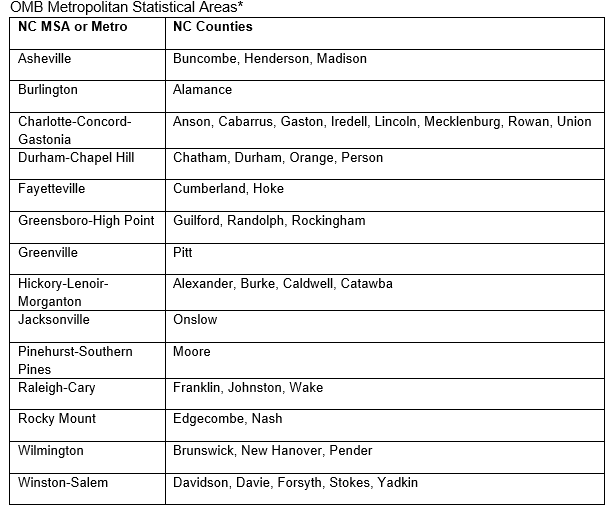
* Not included: Virginia Beach-Chesapeake-Norfolk MSA
Source: NC Department of Commerce
The business landscape is complex. Need help? Contact DMJPS.
For a printer-friendly version, click here.