

Highlights:
DMJPS is pleased to provide the first-quarter 2026 economic update for North Carolina’s 15 metro areas. Estimates showed employment continued to grow, unemployment remained relatively low, and wages increased. At the same time, several indicators pointed to moderating or mixed economic conditions.
- In the first quarter of 2026, North Carolina’s employment averaged 5,042,100 jobs, a year-over-year increase of 43,300 jobs, or 0.9 percent.
- First-quarter employment gains were led by the Wilmington and Raleigh metros. Eight of the state’s fifteen metros posted year-over-year growth, while seven reported declines.
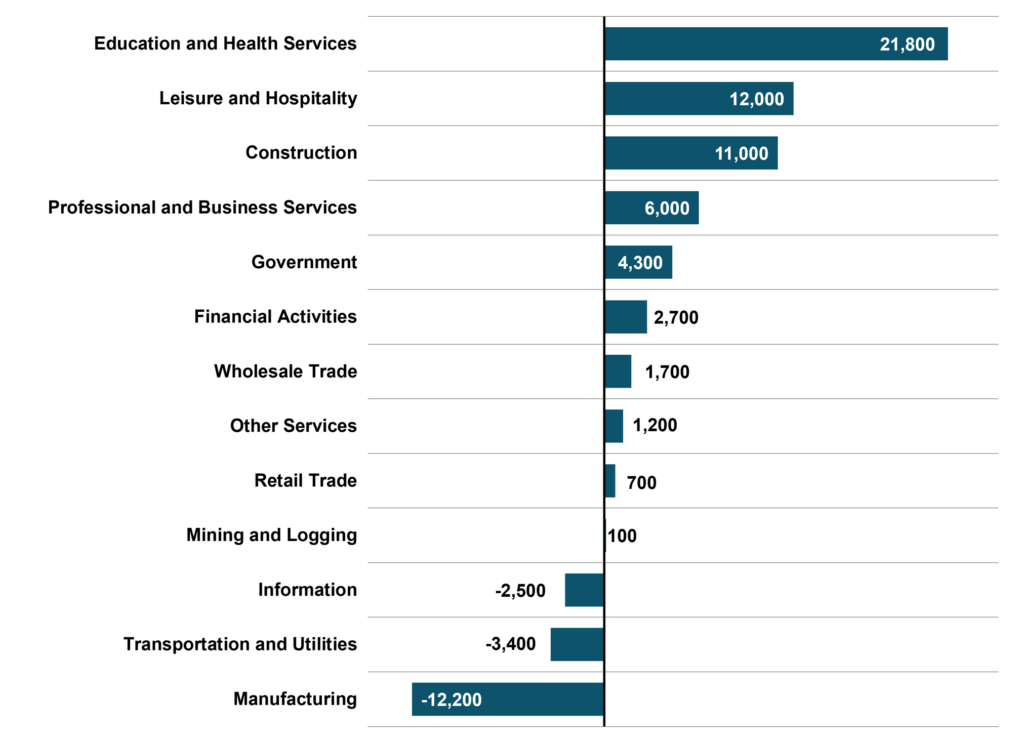
- By major industry, Education and Health Services led job growth by adding an estimated 21,800 jobs year-over-year. The majority of the state’s major industries added jobs; however, Manufacturing lost an estimated 12,200 jobs year over year.
- North Carolina’s unemployment rate averaged 3.8 percent with approximately 200,955 unemployed individuals, representing 3.2 percent fewer unemployed individuals than a year earlier.
- Among the state’s fifteen metros, Raleigh posted the lowest unemployment rate at 3.3 percent, while Rocky Mount recorded the highest at 5.2 percent.
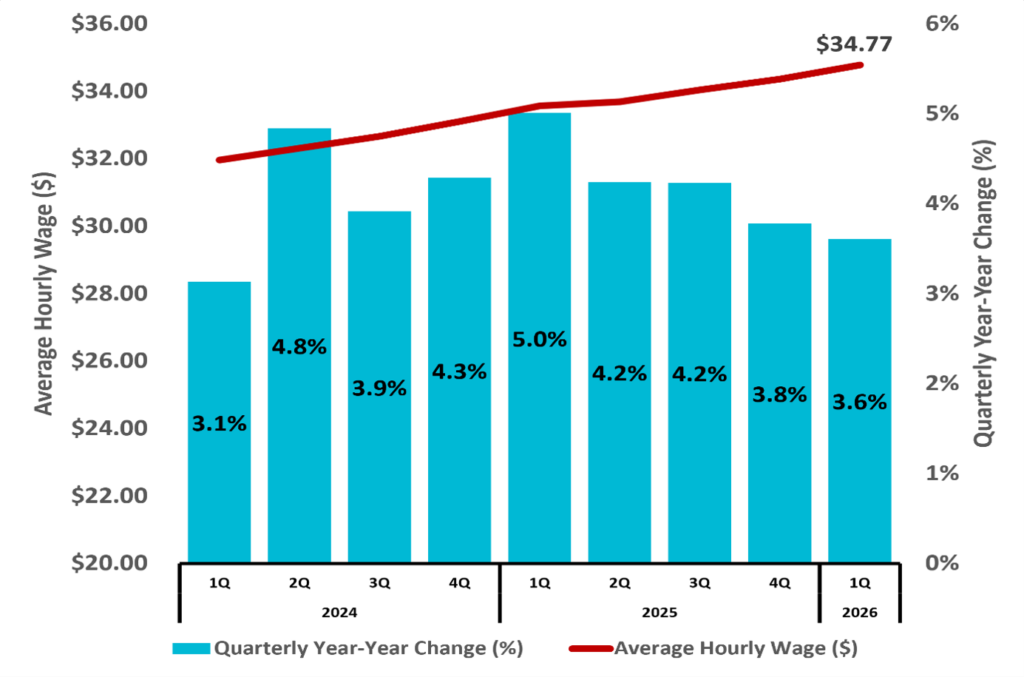
- The state’s average hourly wage in the first quarter was $34.77, up 3.6 percent year-over-year, with Raleigh leading the metros at $37.92.
- Taxable retail sales in North Carolina totaled over $59 billion in the first quarter, an increase of 3.9 percent year-over-year.
- Special feature, North Carolina Class of Worker Structure: According to the U.S. Census Bureau, in 2024, 68.5 percent of North Carolina’s civilian employed population age 16 and over worked as employees of private companies. Nearly 14 percent were classified as government workers, 10 percent as self-employed, and roughly 8 percent as private not-for-profit wage and salary workers.
Detailed Analysis: Employment
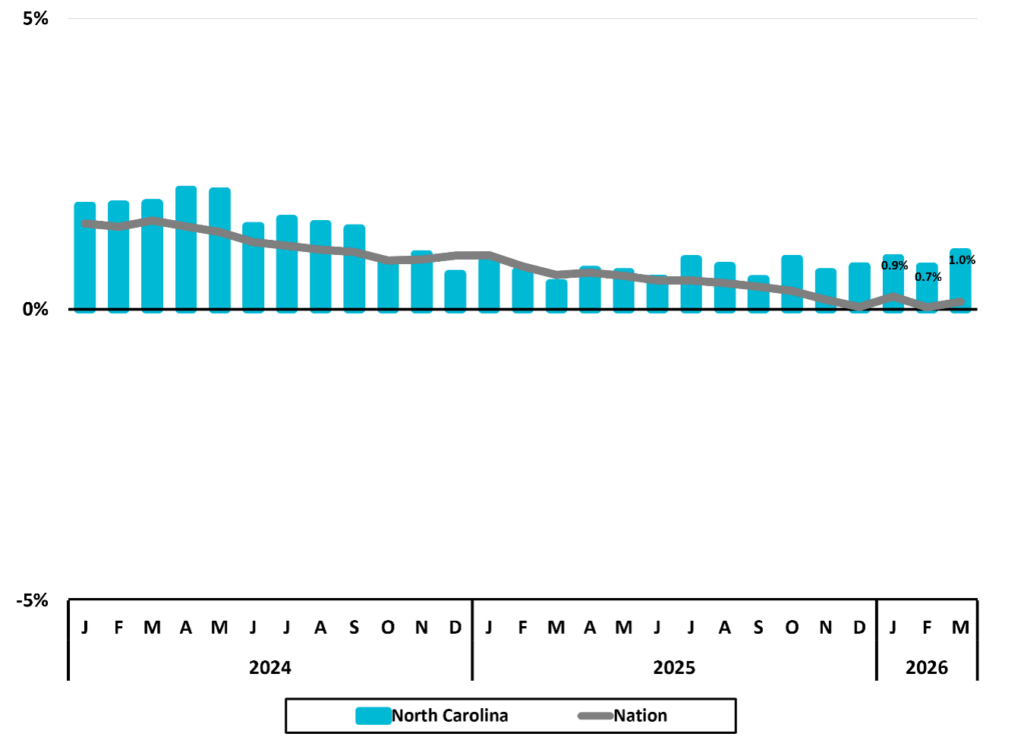
In the first quarter of 2026, North Carolina’s employment averaged 5,042,100 jobs, a 0.9 percent increase year-over-year (Figure 1). The state’s quarterly employment growth exceeded the national rate of 0.1 percent, while monthly year-over-year growth has generally leveled off since late 2024.
Figure 1 North Carolina Total Nonfarm Employment Monthly Year-to-Year Percent Change
 Source: US Bureau of Labor Statistics, All Employees, Total Nonfarm, retrieved from Federal Reserve Bank of St. Louis
Eight of North Carolina’s fifteen metropolitan areas experienced year-over-year employment growth during the first quarter of 2026, while seven reported declines (Figure 2). Six metros exceeded the state’s year-over-year growth rate of 0.9 percent: Wilmington (2.8 percent), Raleigh (1.8 percent), Greenville (1.8 percent), Pinehurst (1.1 percent), Asheville (1.1 percent), and Winston-Salem (1.0 percent). Fayetteville recorded the largest employment decline at 2.1 percent. This was followed by Hickory (-1.4 percent) and Durham-Chapel Hill (-1.1 percent).
Figure 2 2026 1Q Average North Carolina Metros Employment One-Year Percent Change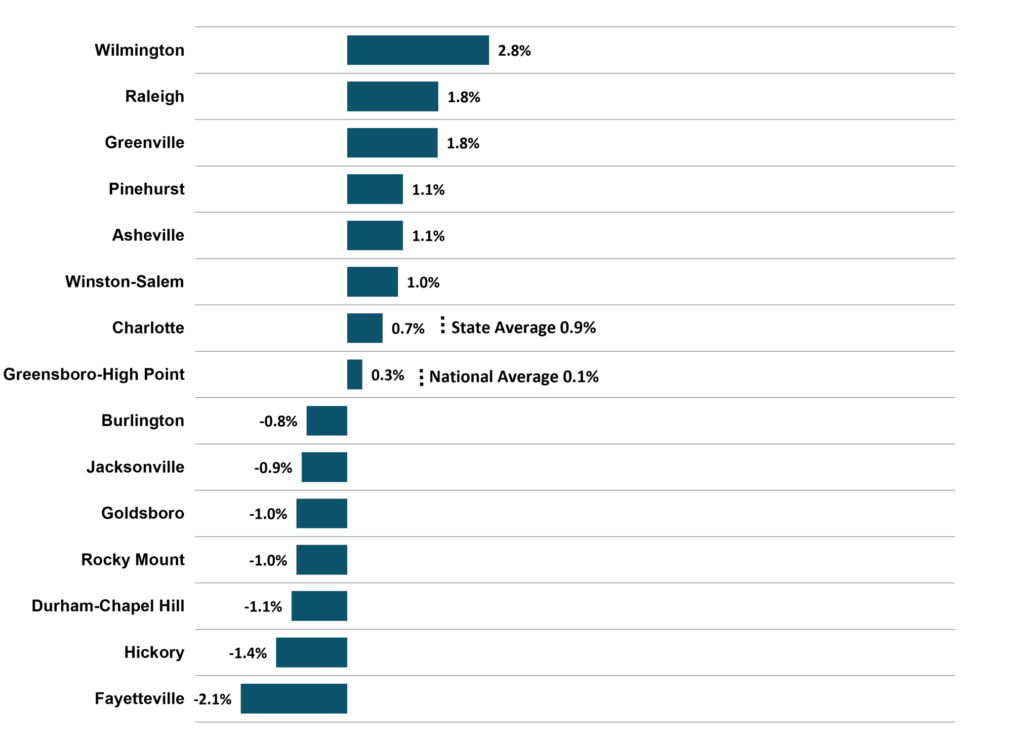 Source: US Bureau of Labor Statistics and Federal Reserve Bank of St. Louis, All Employees: Total Nonfarm by Metro, retrieved from Federal Reserve Bank of St. Louis
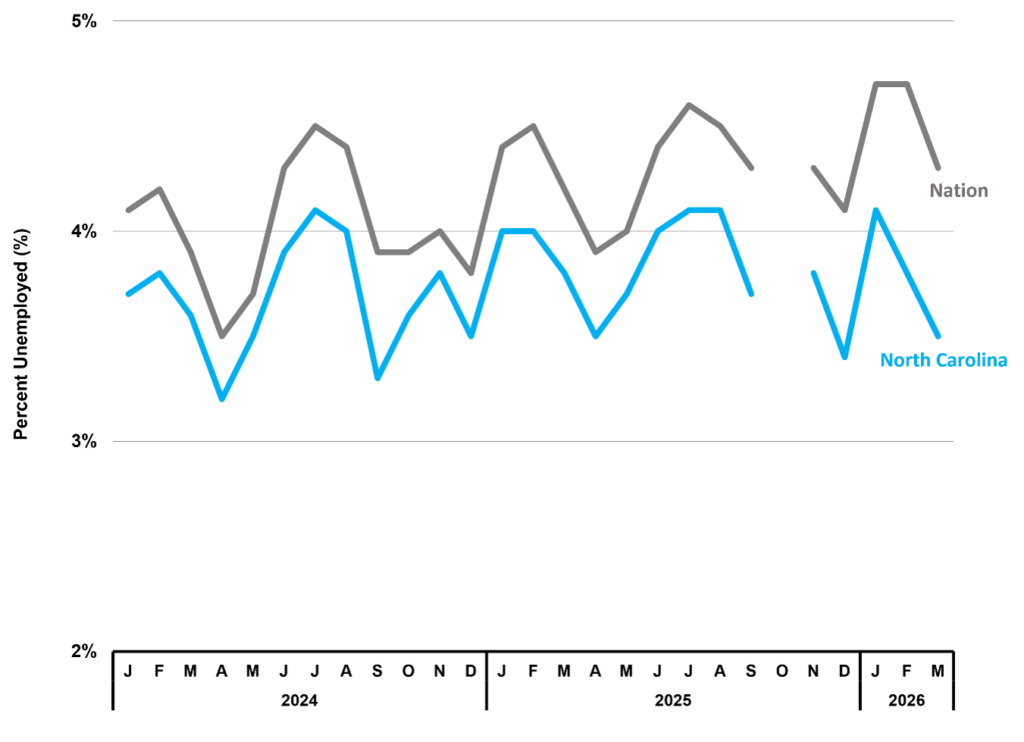
North Carolina’s unemployment rate averaged 3.8 percent in the first quarter of 2026, 0.8 percentage points below the national average of 4.6 percent (Figure 3). This marked the thirteenth consecutive quarter in which the state’s unemployment rate remained below or matched the national rate. The number of unemployed workers averaged 200,955 in the first quarter, down 3.2 percent from the same quarter a year earlier.
Figure 3 North Carolina Unemployment Rate (%)
Source: US Bureau of Labor Statistics Unemployment Rate retrieved from Federal Reserve Bank of St. Louis; NC Department of Commerce
Among North Carolina’s fifteen metropolitan areas, the Raleigh metro had the lowest unemployment rate at 3.3 percent in the first quarter of 2026 (Figure 4). Pinehurst and Durham-Chapel Hill followed at 3.4 percent each, while Asheville recorded a 3.6 percent unemployment rate. Rocky Mount (5.2 percent) and Fayetteville (4.7 percent) had the state’s highest unemployment rates and were the only metros to exceed the national first-quarter average of 4.6 percent. Overall, unemployment rates ranged from 3.3 percent to 5.2 percent, with eight metros at or below the statewide average of 3.8 percent.
Figure 4 North Carolina Metros Unemployment Rate (%) 2026 1Q Average
 Source: US Bureau of Labor Statistics, Unemployment Rate by Metro, retrieved from Federal Reserve Bank of St. Louis
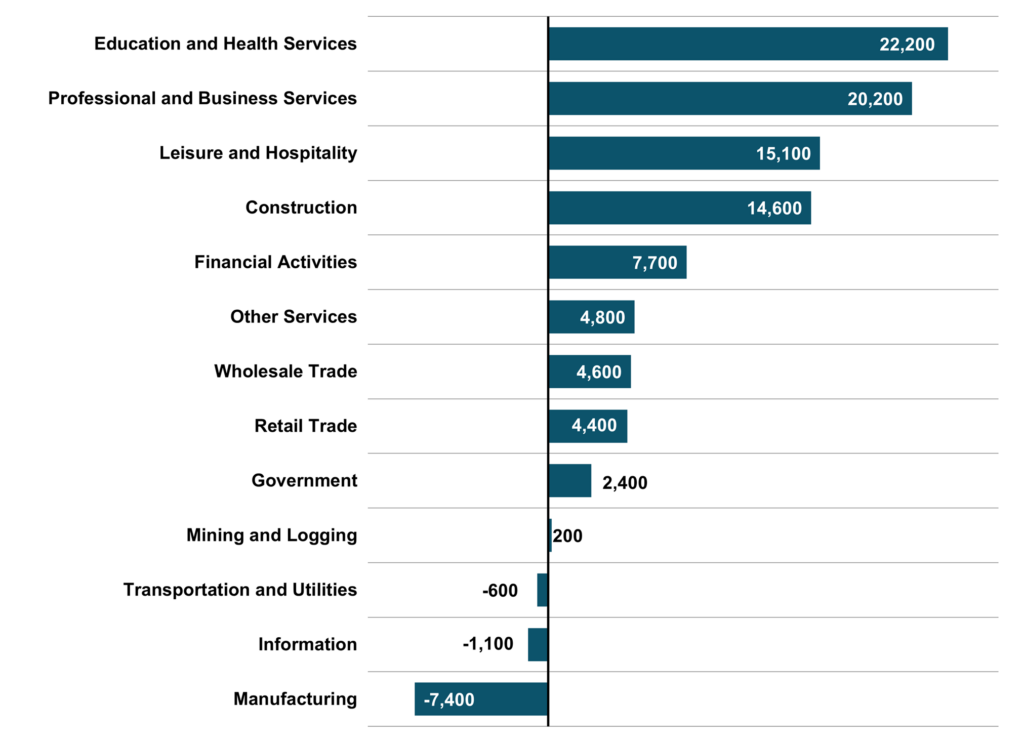
North Carolina added approximately 43,300 jobs year-over-year in the first quarter of 2026 (Figure 5). The state has recorded year-over-year quarterly job growth since the second quarter of 2021 (20 consecutive quarters). By major industry, Education and Health Services led job growth by adding 21,800 jobs. This was followed by Leisure and Hospitality (+12,000) and Construction (+11,000). Three major industries reported year-over-year employment losses: Information (-2,500), Transportation and Utilities (-3,400), and Manufacturing (-12,200). For Manufacturing, this was the largest quarterly year-over-year decline since the first quarter of 2021.
Figure 5 North Carolina – 2026 1Q Major Industry Employment One-Year Change
 Source: US Bureau of Labor Statistics, All Employees by Major Industry in North Carolina, retrieved from Federal Reserve Bank of St. Louis
Wages
North Carolina’s average hourly wage rose to $34.77 in the first quarter of 2026, representing an increase of 3.6 percent from a year earlier (Figure 6). Although wages continued to increase, the year-over-year growth rate was slower compared to the previous seven quarters.
Figure 6 North Carolina Average Hourly Wages Private Industry
 Source: US Bureau of Labor Statistics and Federal Reserve Bank of St. Louis, Average Hourly Earnings of All Employees: Total Private in North Carolina
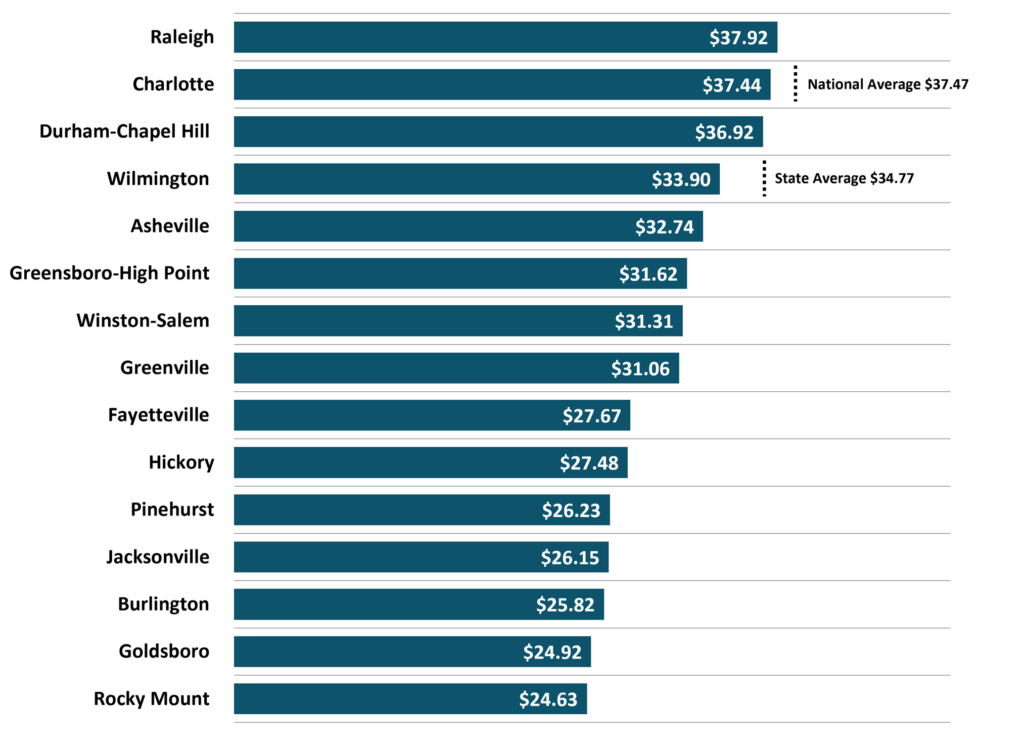
The Raleigh metro recorded the highest average hourly wage at $37.92 and was the only metro in the first quarter to exceed both the national average of $37.47 and the state average of $34.77 (Figure 7). Charlotte and Durham-Chapel Hill also exceeded the state average, although neither exceeded the national average. Rocky Mount recorded the lowest average hourly wage at $24.63, a difference of $13.29 per hour from Raleigh.
Figure 7 North Carolina Metros – 2026 1Q Average Hourly Wages Private Industry
Source: US Bureau of Labor Statistics and Federal Reserve Bank of St. Louis, Average Hourly Earnings of All Employees: Total Private by Metro, retrieved from Federal Reserve Bank of St. Louis
Housing
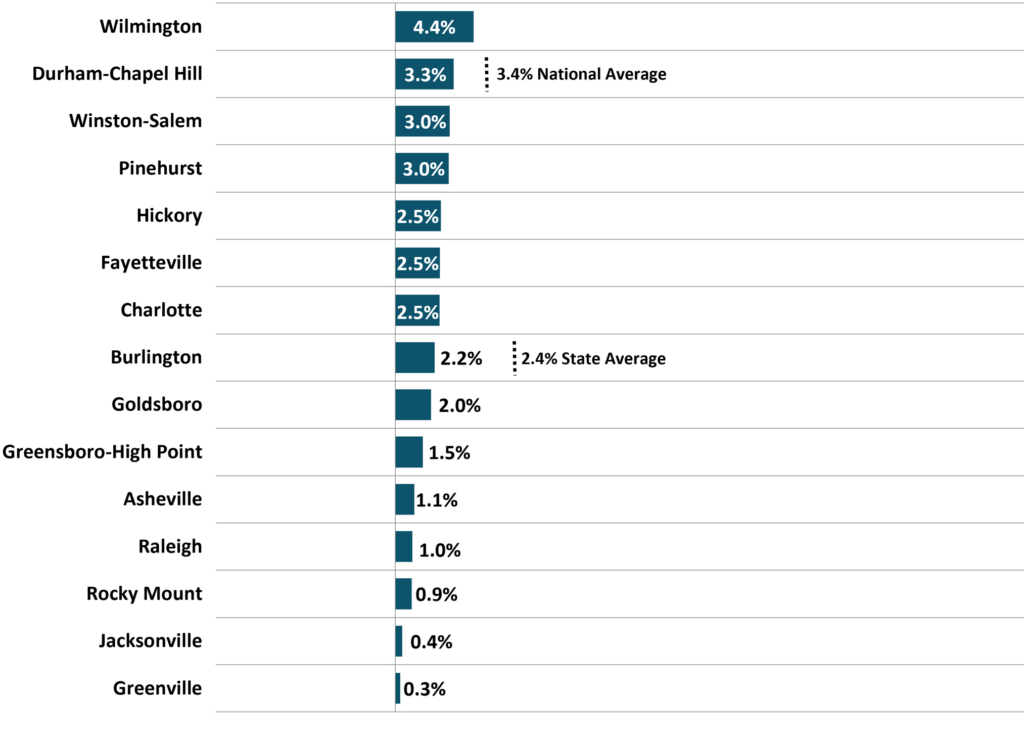
North Carolina’s annual house price appreciation rate was 2.4 percent in the first quarter of 2026, below the national rate of 3.4 percent (Figure 8). Wilmington recorded the highest appreciation rate among North Carolina’s fifteen metros at 4.4 percent, while Greenville recorded the lowest at 0.3 percent. All fifteen metros recorded positive appreciation rates.
Figure 8 North Carolina Metros Annual Appreciation Rate (%) 2026 1Q
 Source: US Federal Housing Finance Agency, All-Transactions House Price Index, retrieved from Federal Reserve Bank of St. Louis
Permit activity for new residential building in North Carolina totaled 21,994 units in the first quarter, with a value of $5,518,052,000 (Figure 9). This represented a year-over-year decline of 6.1 percent in the number of units permitted, while total permitted value decreased by 2.8 percent. Multi-family units accounted for 7,197 permits, or approximately 33 percent of units permitted, up 18.4 percent compared to the first quarter of 2025.
Figure 9 North Carolina Estimated Residential Building Permit Activity*
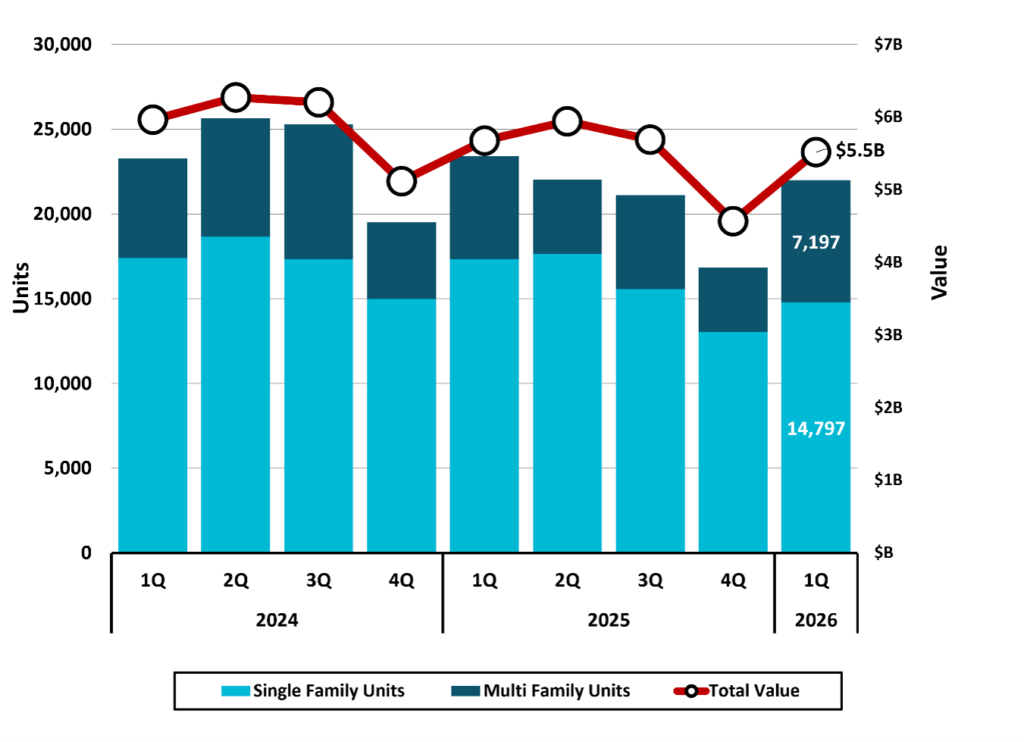 *Based on a survey of permitting agencies. The Census Bureau provides estimates for any missing agency data, which typically amounts to less than 20% of the total permits. Source: US Census Bureau
Retail Sales
Taxable retail sales in North Carolina totaled $59,186,203,287 ($59 billion) in the first quarter of 2026 (Figure 10). Year-over-year growth of 3.9 percent exceeded first quarter growth in both 2024 and 2025 (Figure 11). Although $59 billion was not the highest quarterly total, it was the highest first quarter total on record.
Figure 10 North Carolina Total Taxable Retail Sales
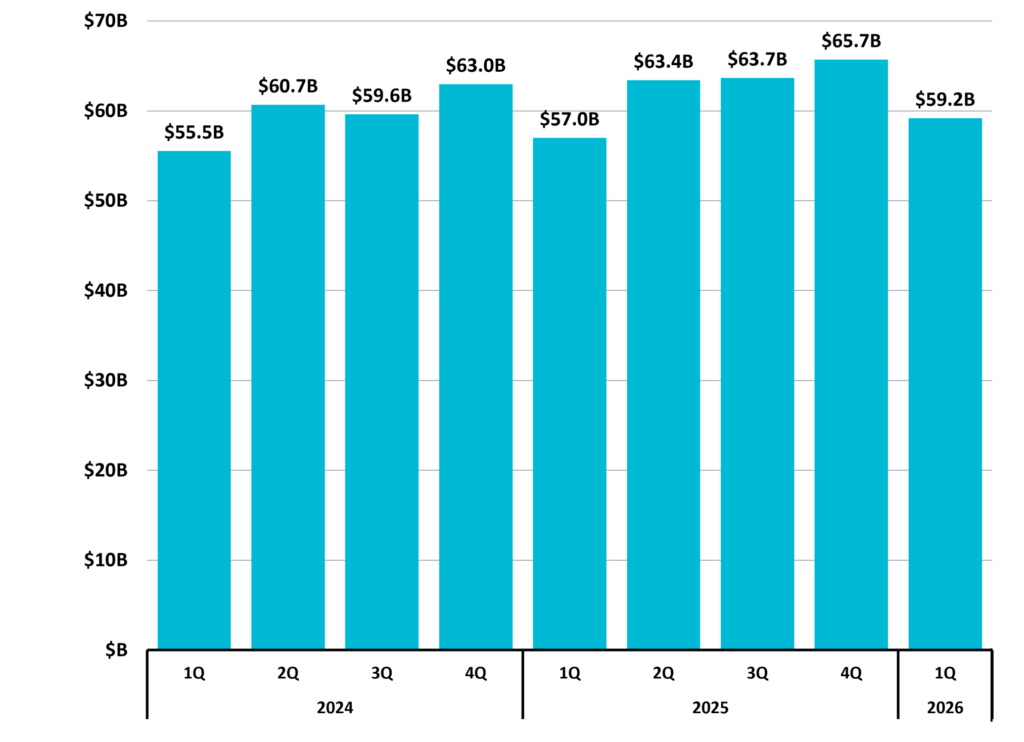 Includes collections of penalties, interest, and sales & use tax; and may reflect activity from prior periods. Source: NC Department of Revenue
Figure 11 North Carolina Total Taxable Retail Sales Quarterly Year-to-Year Change (%)
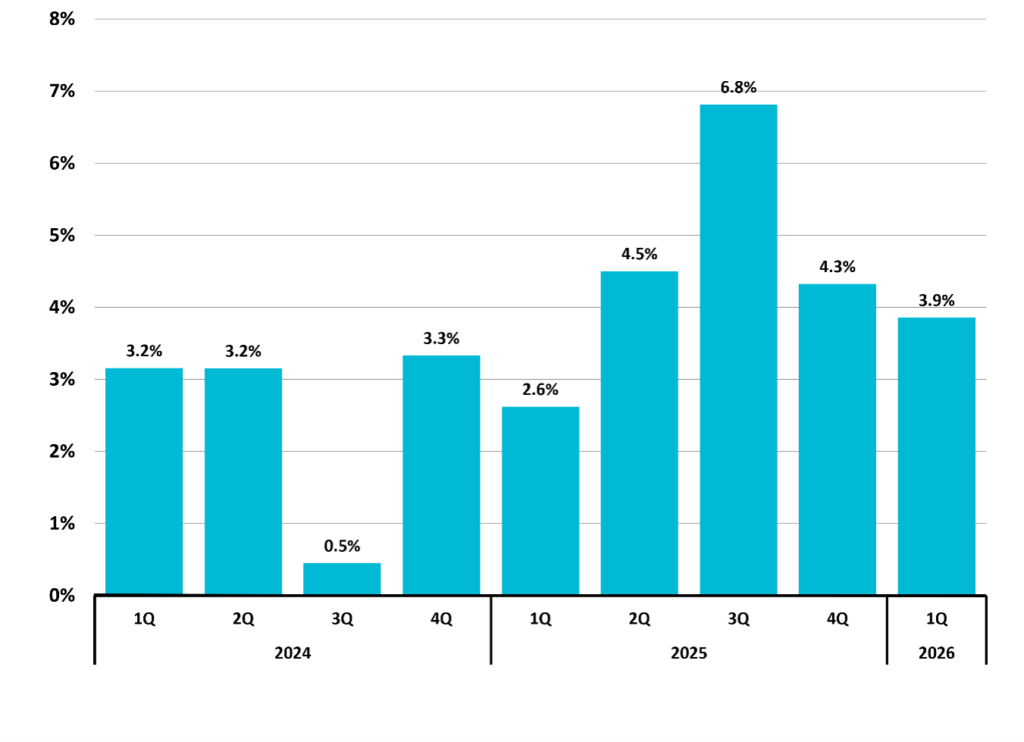 Includes collections of penalties, interest, and sales & use tax; and may reflect activity from prior periods. Source: NC Department of Revenue
Special Feature: North Carolina Class of Worker Structure
According to the U.S. Census Bureau’s class of worker statistics, more than two-thirds (68.5 percent) of North Carolina’s civilian employed population age 16 and over worked as employees of private companies in 2024 — the most current year available (Figure 12). Government employees accounted for 13.7 percent of the workforce, followed by 7.8 percent employed by private not-for-profit organizations. An additional 10.0 percent were self-employed, split between those in unincorporated businesses (5.8 percent) and incorporated businesses (4.2 percent). These employment patterns provide insight into the structure of North Carolina’s employed workforce.
Figure 12 North Carolina Class of Worker, 2024
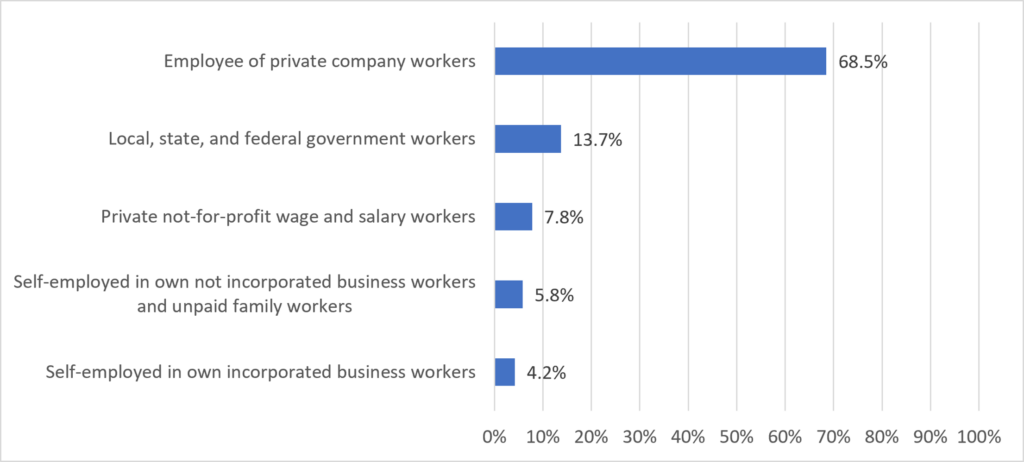 Source: US Census Bureau
The business landscape is complex. Need help? Contact DMJPS.
For a printer-friendly version, click here.
End note: Data in this report reflect a point in time, June 2026, and may be subject to periodic adjustment.