Highlights:
DMJPS is pleased to provide a statewide quarterly economic report with highlights of North Carolina’s fifteen metros for the 3rd quarter of 2023. Indicators suggest the state has maintained its standing and experienced overall steady growth compared to a year prior.
• In the third quarter of 2023, employment in North Carolina averaged just over 4.9 million, marking the second highest quarterly average for the state on record.
• North Carolina’s third quarter average unemployment rate of 3.5 percent was lower than the national 3.8 percent. Five of the state’s fifteen metros experienced an unemployment rate that was greater than the national rate in the third quarter of 2023.
• Manufacturing was the only major industry to lose jobs in the third quarter compared to the third quarter a year prior.
• The private industry average hourly wage in North Carolina rose to $31.45 in the third quarter, the highest average hourly wage of any quarter dating back to 2007. This increase offset the slight drop between the first and second quarters of 2023. Durham-Chapel Hill metro had the highest average hourly wage at $36.54.
• At 6.2 percent, North Carolina’s same-home annual appreciation rate in the third quarter outpaced the national rate of 4.8 percent. The Jacksonville metro ranked first among the state’s metros at 13.3 percent.
• Taxable retail sales in North Carolina totaled $59.3 billion in the third quarter of 2023 for a 2.9 percent increase compared to a year earlier. This growth rate was notably lower when compared to 2021 and 2022 third quarter year-over-year percentage increases.
• Special feature, household income: North Carolina’s average household income was $92,878 in 2022. However, the average household income for families was 95% higher when compared to nonfamily households.
Detailed Analysis:
Employment
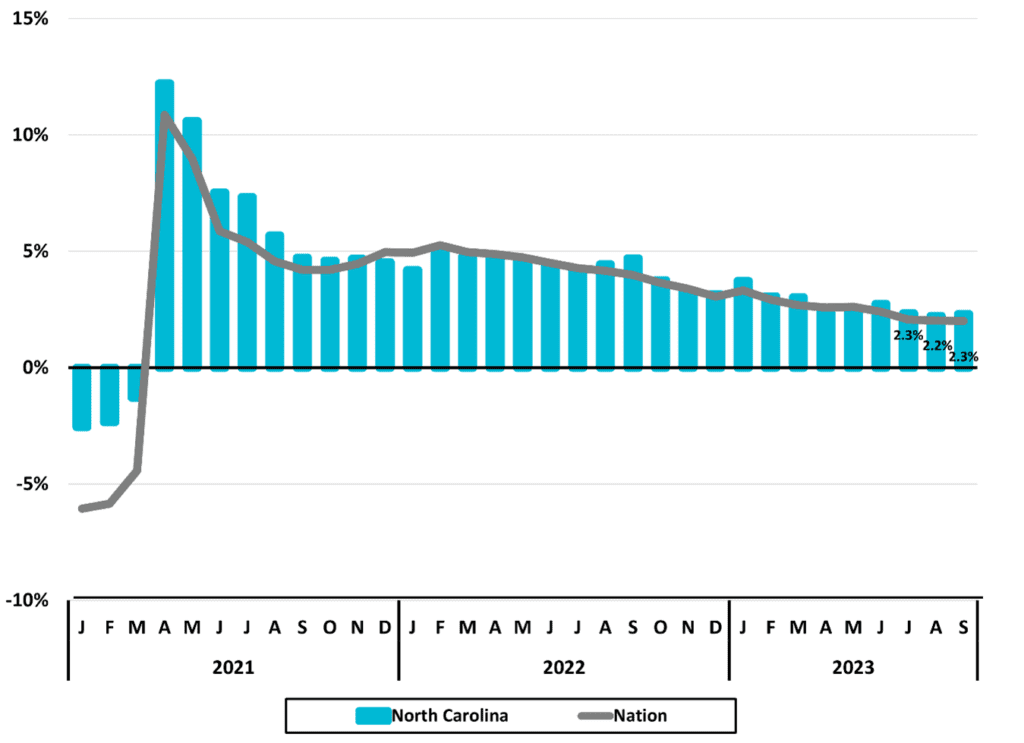
In the third quarter of 2023, employment averaged 4,916,100 employees in the state of North Carolina. This represented little change compared to the previous quarter’s average of 4,917,400 which was the highest quarterly average on record. Compared to a year earlier, the third quarter experienced an average percentage increase of 2.3 percent and outpaced the nation’s third quarter average of 2.0 percent (Figure 1).
Figure 1
North Carolina Total Employment
Monthly Year-to-Year
Percent Change
 Source: US Bureau of Labor Statistics
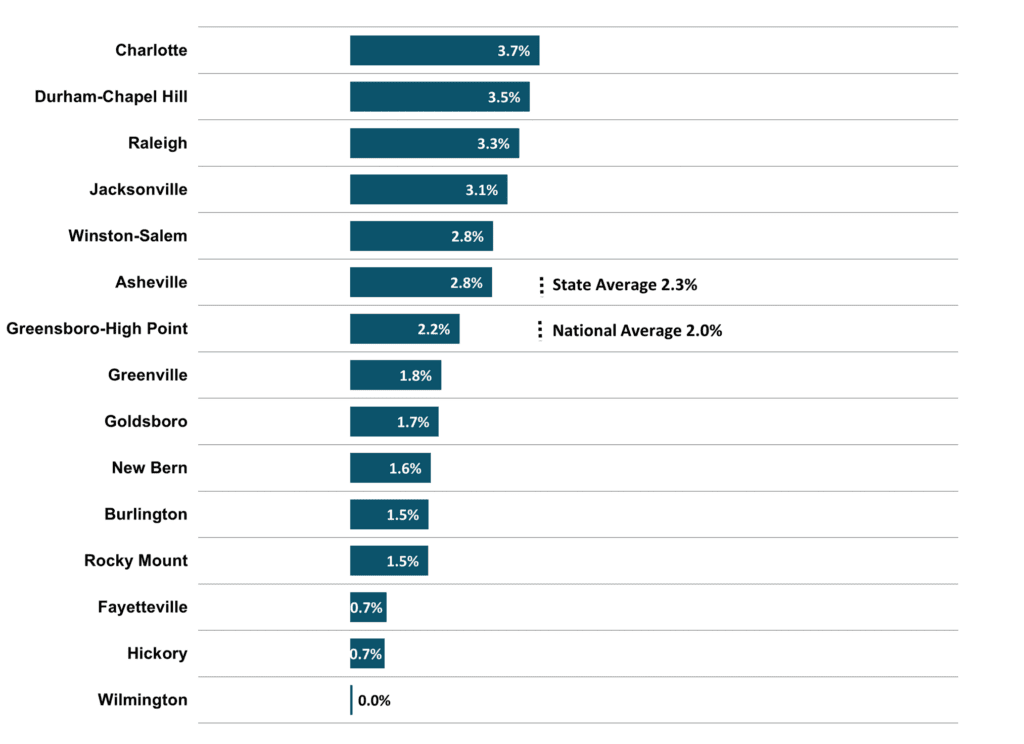
Each of North Carolina’s fifteen metros gained employment in the third quarter of 2023 compared to a year earlier, however, the Wilmington metro remained relatively flat (Figure 2). The state’s fastest growing metro in the third quarter was Charlotte with a 3.7 percent gain. Six metros outpaced both the state’s overall third quarter average of 2.3 percent, as well as the national average of 2.0 percent: Charlotte, Durham-Chapel Hill, Raleigh, Jacksonville, Winston-Salem, and Asheville.
Figure 2
2023 3Q Average
North Carolina Metros
Employment One-Year Percent Change
 Source: US Bureau of Labor Statistics
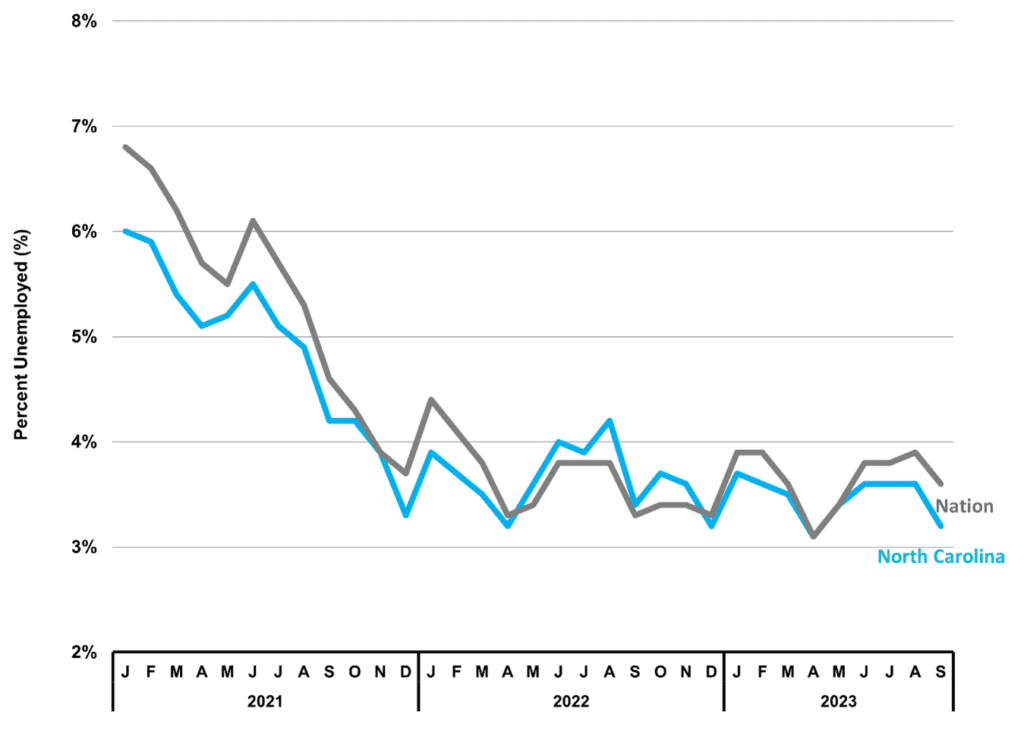
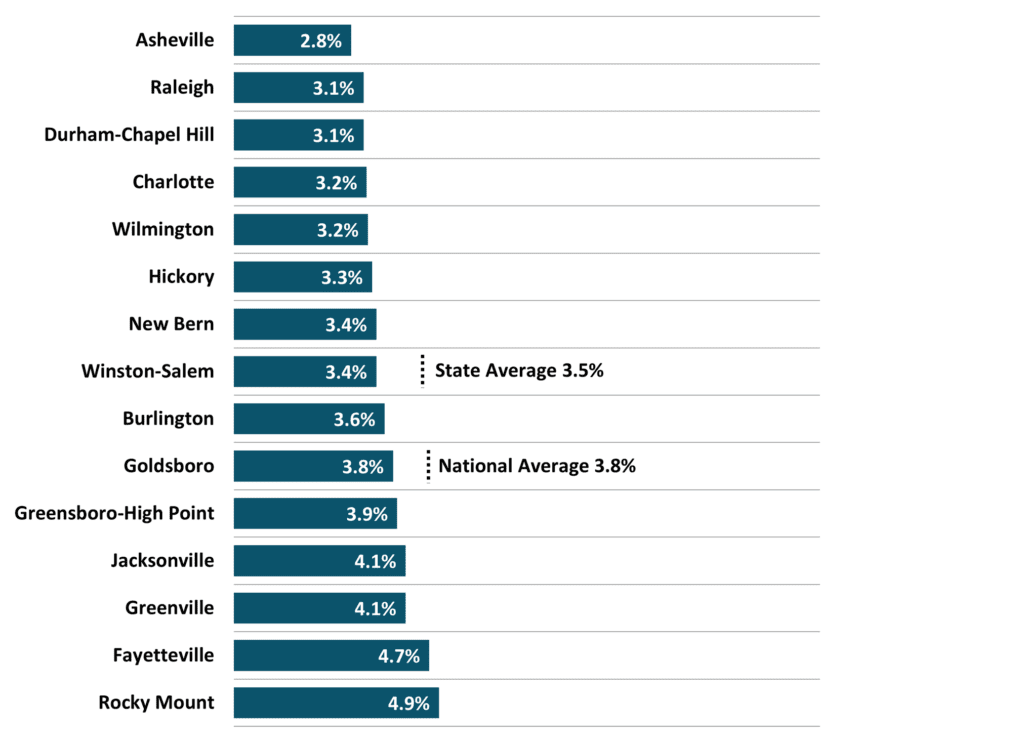
North Carolina’s unemployment rate averaged 3.5 percent in the third quarter of 2023, lower compared to the national average of 3.8 percent (Figure 3). The third quarter 2023 unemployment rate translated into approximately 182,740 unemployed residents, 8.1 percent less compared to a year earlier. The state’s unemployment rate has remained below five percent for nine consecutive quarters and below four percent for eight consecutive quarters.
Rocky Mount metro had the highest third quarter average unemployment rate at 4.9 percent while Asheville metro had the lowest average at 2.8 percent (Figure 4). Five of the state’s fifteen metros experienced an unemployment rate that was greater than the national average in the third quarter: Greensboro-High Point, Jacksonville, Greenville, Fayetteville, and Rocky Mount.
Figure 3
North Carolina
Unemployment Rates (%)
 Source: US Bureau of Labor Statistics
Figure 4
North Carolina Metros
Unemployment Rate (%)
2023 3Q Average
 Source: US Bureau of Labor Statistics
With the exception of Manufacturing, each of North Carolina’s major industry sectors added employment in the third quarter of 2023 compared to the same point a year earlier (Figure 5). Education and Health Services led major industry growth with a net gain of 29,300 jobs. Leisure and Hospitality added 27,700 jobs while Professional and Business Services added 20,100 new jobs. After nine consecutive quarters with year-over-year employment gains, Manufacturing experienced a loss of 900 jobs in the third quarter of 2023.
Figure 5
North Carolina – 2023 3Q
Major Industry Employment
One-Year Change
 Totals rounded to nearest 100.
Source: US Bureau of Labor Statistics
Wages
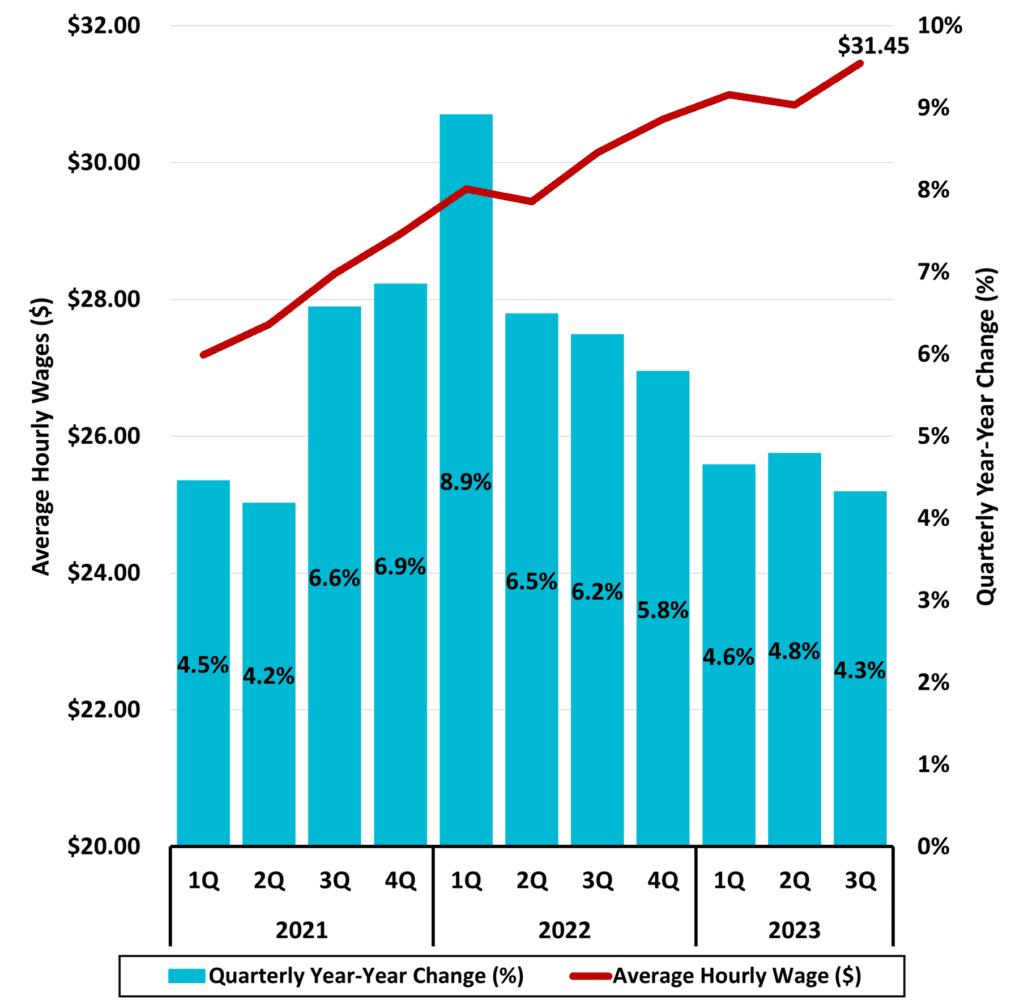
Private industry average hourly wages in North Carolina rose to an average $31.45 in the third quarter of 2023 which was an increase following a slight downturn between the 2023 first and second quarters (Figure 6). The third quarter average marked the highest quarterly average dating back to 2007 and represented a 4.3 percent increase compared to a year earlier.
Figure 6
North Carolina
Average Hourly Wages
Private Industry
 Source: NC Department of Commerce
Durham-Chapel Hill led the state’s fifteen metros with a third quarter average hourly wage of $36.54 (Figure 7). Two of the state’s fifteen metros exceeded both the overall state average of $31.45 and the national average of $33.77: Durham-Chapel Hill and Charlotte. At $32.80, the Raleigh metro exceeded the state average but did not exceed the national average in the third quarter.
Figure 7
North Carolina Metros – 2023 3Q
Average Hourly Wages
Private Industry
 Source: NC Department of Commerce
Housing
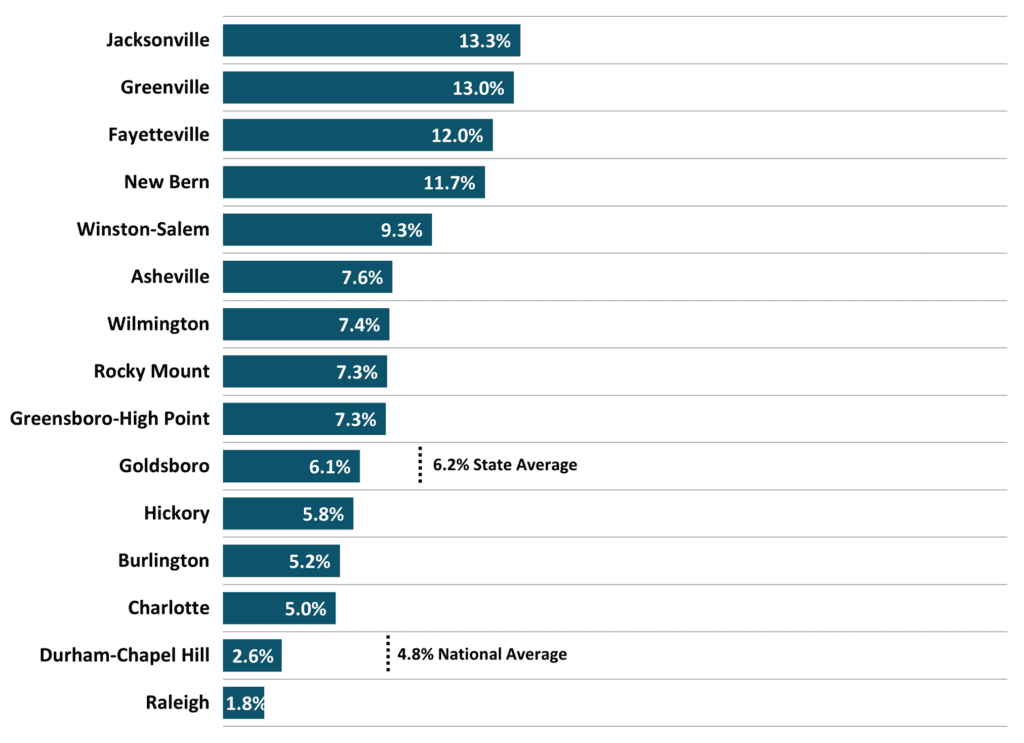
At 6.2 percent, the state of North Carolina’s same-home annual appreciation rate in the third quarter exceeded the national average of 4.8 percent (Figure 8). The majority of state metros exceeded the state’s overall average with Jacksonville metro ranking first at 13.3 percent. Only two of the state’s metros experienced appreciation rates that trailed the national average in the third quarter: Durham-Chapel Hill at 2.6 percent and Raleigh at 1.8 percent.
Figure 8
North Carolina Metros
Same-Home Annual Appreciation Rate (%)
2023 3Q
 Source: Federal Reserve Bank of St. Louis
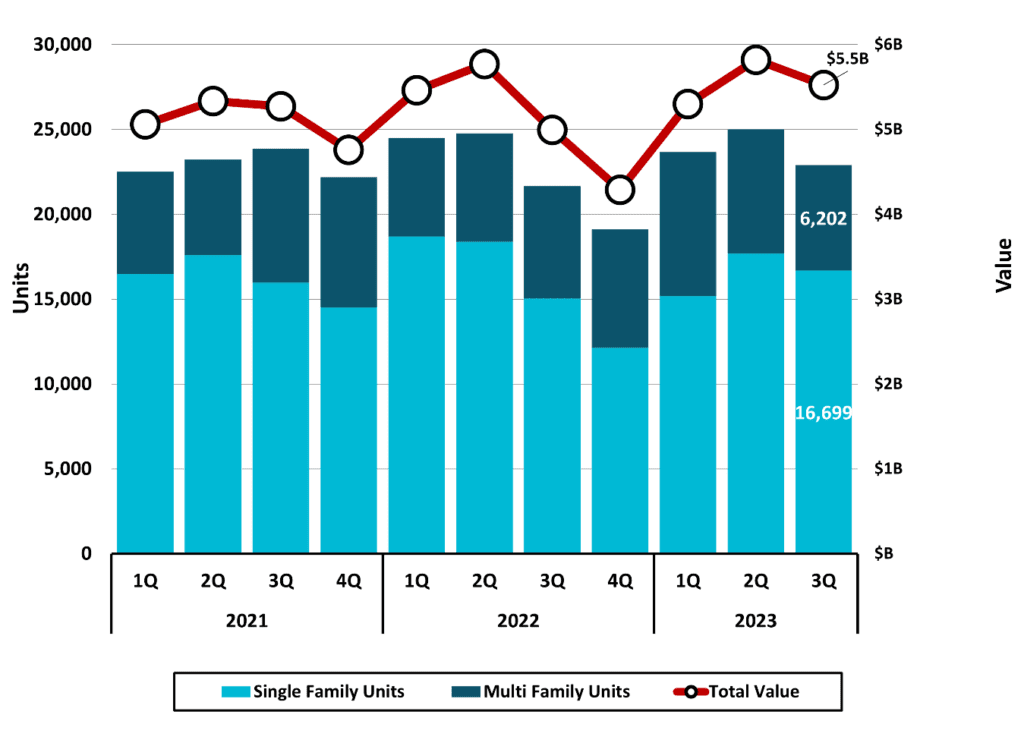
Estimated permit activity for new residential building in the state of North Carolina totaled 22,901 units in the third quarter of 2023 with a value of $5,525,033,000 (Figure 9). In percentage terms, the total number of units permitted was 5.7 percent greater than a year prior, and the total value was 10.6 percent greater. Permitted multi-family units totaled 6,202 and accounted for 27 percent of total units.
Figure 9
North Carolina
Estimated Residential Building Permits Activity*
 *Based on a survey of permitting agencies. The Census Bureau provides estimates for
any missing agency data, which typically amounts to less than 20% of the total permits.
Source: US Census Bureau
Retail Sales
Taxable retail sales in North Carolina totaled $59,338,837,764 ($59.3 billion) in the third quarter of 2023, a 2.9 percent increase compared to a year earlier (Figure 10 and Figure 11). This was a lower rate compared to the third quarter year-over-year change in 2022 and 2021, however, taxable retail sales for each third quarter have increased steadily in dollar amount looking as far back as 2021.
Figure 10
North Carolina
Total Taxable Retail Sales
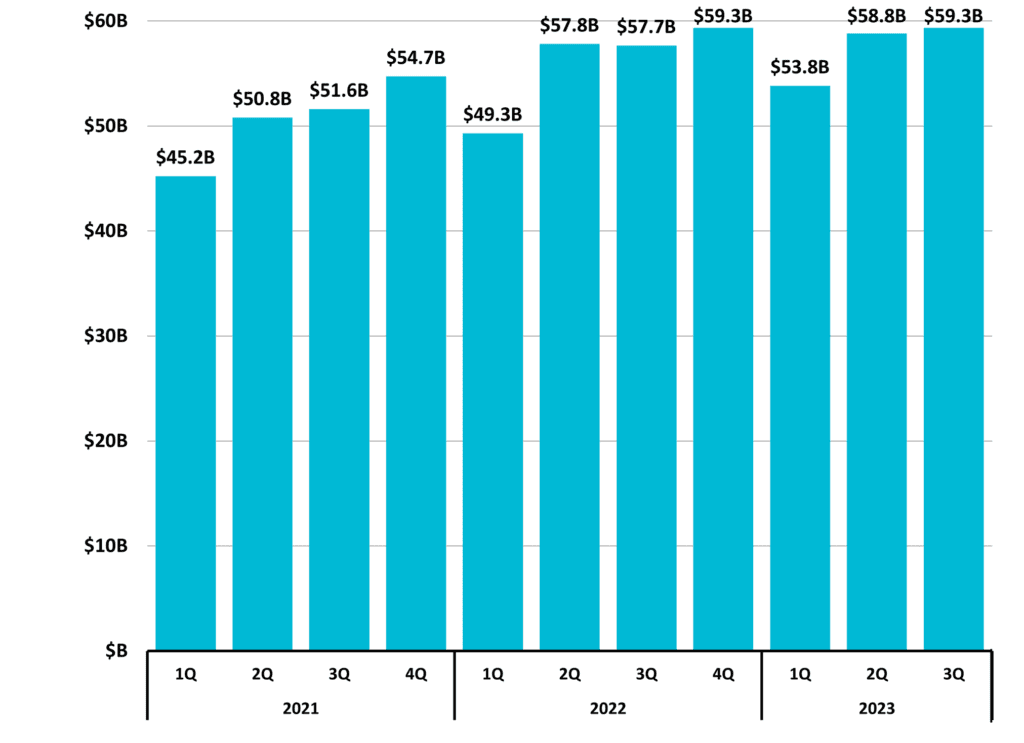 Includes collections of penalties, interest, and sales & use tax; and may reflect activity from prior periods.
Source: NC Department of Revenue
Figure 11
North Carolina
Total Taxable Retail Sales
Quarterly Year-to-Year Change (%) Includes collections of penalties, interest, and sales & use tax; and may reflect activity from prior periods.
Source: NC Department of Revenue
Special Feature:
Household Income
The demographic in Figure 12 looks at households and income. The United States Census Bureau provides household income estimates which are divided into two categories, family and nonfamily. Family households are a group of people related by birth, marriage, or adoption and residing together. Nonfamily households include those who live alone or who share exclusively with people they are not related to. Of non-family households, many consist of only one person. Because of this, overall average household income is usually less than the average for family households. In 2022, this was the case in all states, including North Carolina.
Income for households in this measure may be derived from a variety of sources such as wages, trusts, social security, interest, rental, and others. In North Carolina, the average household income was $92,878 in 2022. The average for family households was $110,687 and the average for non-family households was $56,797, making family household income 95 percent greater than nonfamily household income.
A subset of family households includes married-couple families. Married-couple families had the greatest estimated average household income in 2022.
Figure 12
North Carolina
2022 Household Income Estimates
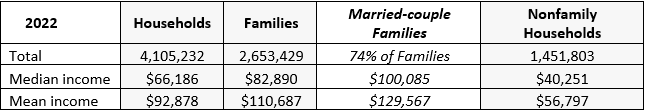 Source: US Census Bureau
The business landscape is complex. Need help? Contact DMJPS.
For a printer-friendly version, click here.