
Highlights:
DMJPS is pleased to provide the first quarter 2025 economic update across North Carolina’s fifteen metro areas. The state’s economic indicators indicate continued job growth and consumer spending. Employment gains were recorded across most major industries, but unemployment in some areas, such as Asheville, reflects lingering challenges.
- In the first quarter of 2025, North Carolina’s employment averaged 5,034,100, an increase of 67,300 new jobs year over year.
- By metro, Goldsboro led the first quarter of employment growth, with a 3.2 percent increase compared to the previous year.
- By major industry, first quarter employment gains were led by Education and Health Services with an estimated 21,100 new jobs year-over-year.
- North Carolina’s unemployment rate averaged 3.8 percent in the first quarter, translating to just over 200,000 unemployed North Carolinians, an increase of 2.6 percent compared to the previous year.
- Among the state’s fifteen metros, Asheville recorded the highest unemployment rate at 5.4 percent, reflecting continued impacts of Hurricane Helene.
- Residential building permit activity totaled just over 23,400 units in the first quarter with a value of $5.7 billion, which was down 4.8 percent.
- Taxable retail sales in North Carolina totaled $57 billion in the first quarter, representing a moderate increase of 2.6 percent year-over-year.
- Special feature, Health Insurance Coverage Status: In North Carolina, 9.2 percent of the noninstitutionalized population was estimated to be uninsured in 2023, a considerable improvement in coverage compared to 2013, when the percentage of uninsured was nearly 16 percent.
Detailed Analysis:
Employment
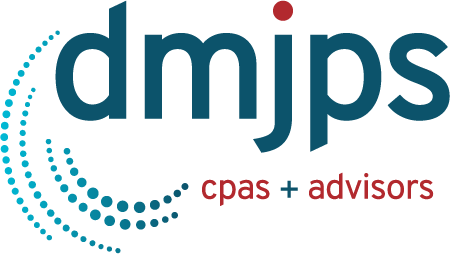
North Carolina’s employment averaged 5,034,100 jobs in the first quarter of 2025, marking the second-highest quarterly average on record, down slightly from the previous quarter’s average of 5,064,100. The state’s first quarter year-over-year increase of 1.4 percent exceeded the national average of 1.3 percent (Figure 1).
Figure 1
North Carolina Total Nonfarm Employment
Monthly Year-to-Year
Percent Change
 Source: US Bureau of Labor Statistics, All Employees, Total Nonfarm, retrieved from Federal Reserve Bank of St. Louis
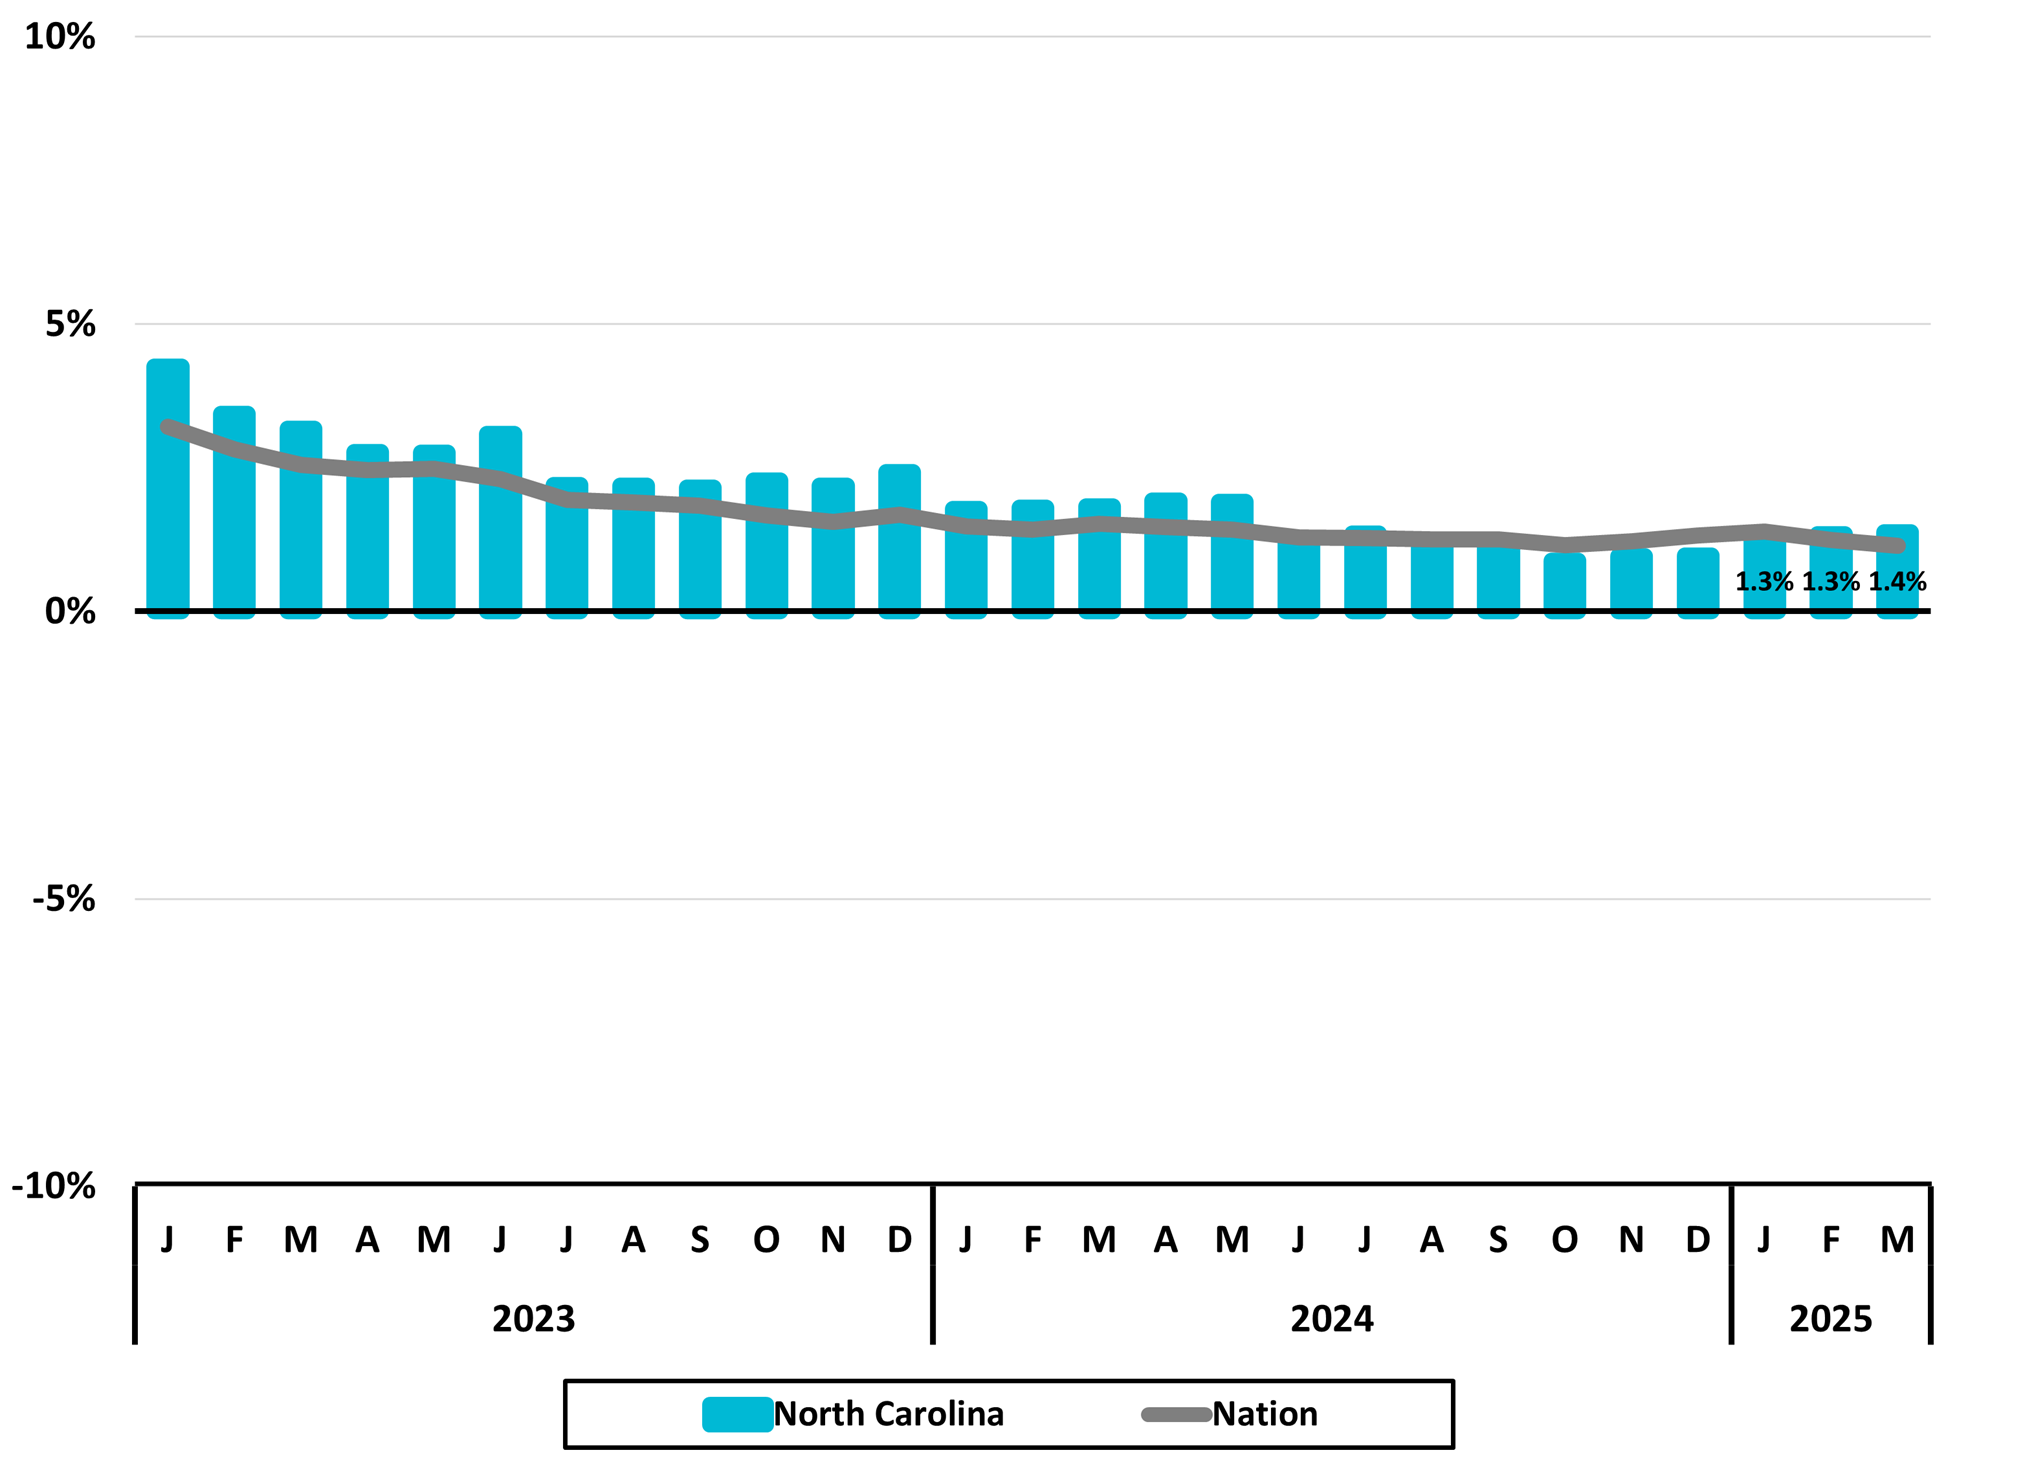
In the first quarter of 2025, Goldsboro (+3.2 percent), Raleigh (+2.0 percent), and Wilmington (+2.0 percent) led the state metros in employment growth (Figure 2), continuing a pattern seen in the previous quarter. Twelve of the state’s fifteen metros experienced year-over-year employment gains while growth in six metros outpaced the state average of 1.4 percent: Winston-Salem, Durham-Chapel Hill, Charlotte, Wilmington, Raleigh, and Goldsboro.
The Asheville metro reported a -0.6 percent change, an improvement from the -1.3 percent in the fourth quarter of 2024. The shift may include early signs of recovery from the impacts of Hurricane Helene; however, the change also coincides with the removal of Haywood County from the metro definition, which may have an influence on the change. Fayetteville (-0.9 percent) and Greenville (-0.2 percent) also recorded year-over-year job losses, though each declined by less than one percent.
Figure 2
2025 1Q Average
North Carolina Metros
Employment One-Year Percent Change
 Source: US Bureau of Labor Statistics and Federal Reserve Bank of St. Louis, All Employees: Total Nonfarm by Metro, retrieved from Federal Reserve Bank of St. Louis
North Carolina’s unemployment rate averaged 3.8 percent in the first quarter of 2025, 0.6 percentage points below the national average of 4.4 percent (Figure 3). This marked the ninth consecutive quarter in which the state’s average was lower than the national average. Additionally, the state’s quarterly average unemployment rate has remained below four percent since the fourth quarter of 2021.
The unemployment rate represented 200,057 North Carolinians who were unemployed and available to work—a 2.6 percent increase compared to the same quarter a year earlier.
Figure 3
North Carolina
Unemployment Rates (%)

Source: US Bureau of Labor Statistics Unemployment Rate retrieved from Federal Reserve Bank of St. Louis; NC Department of Commerce
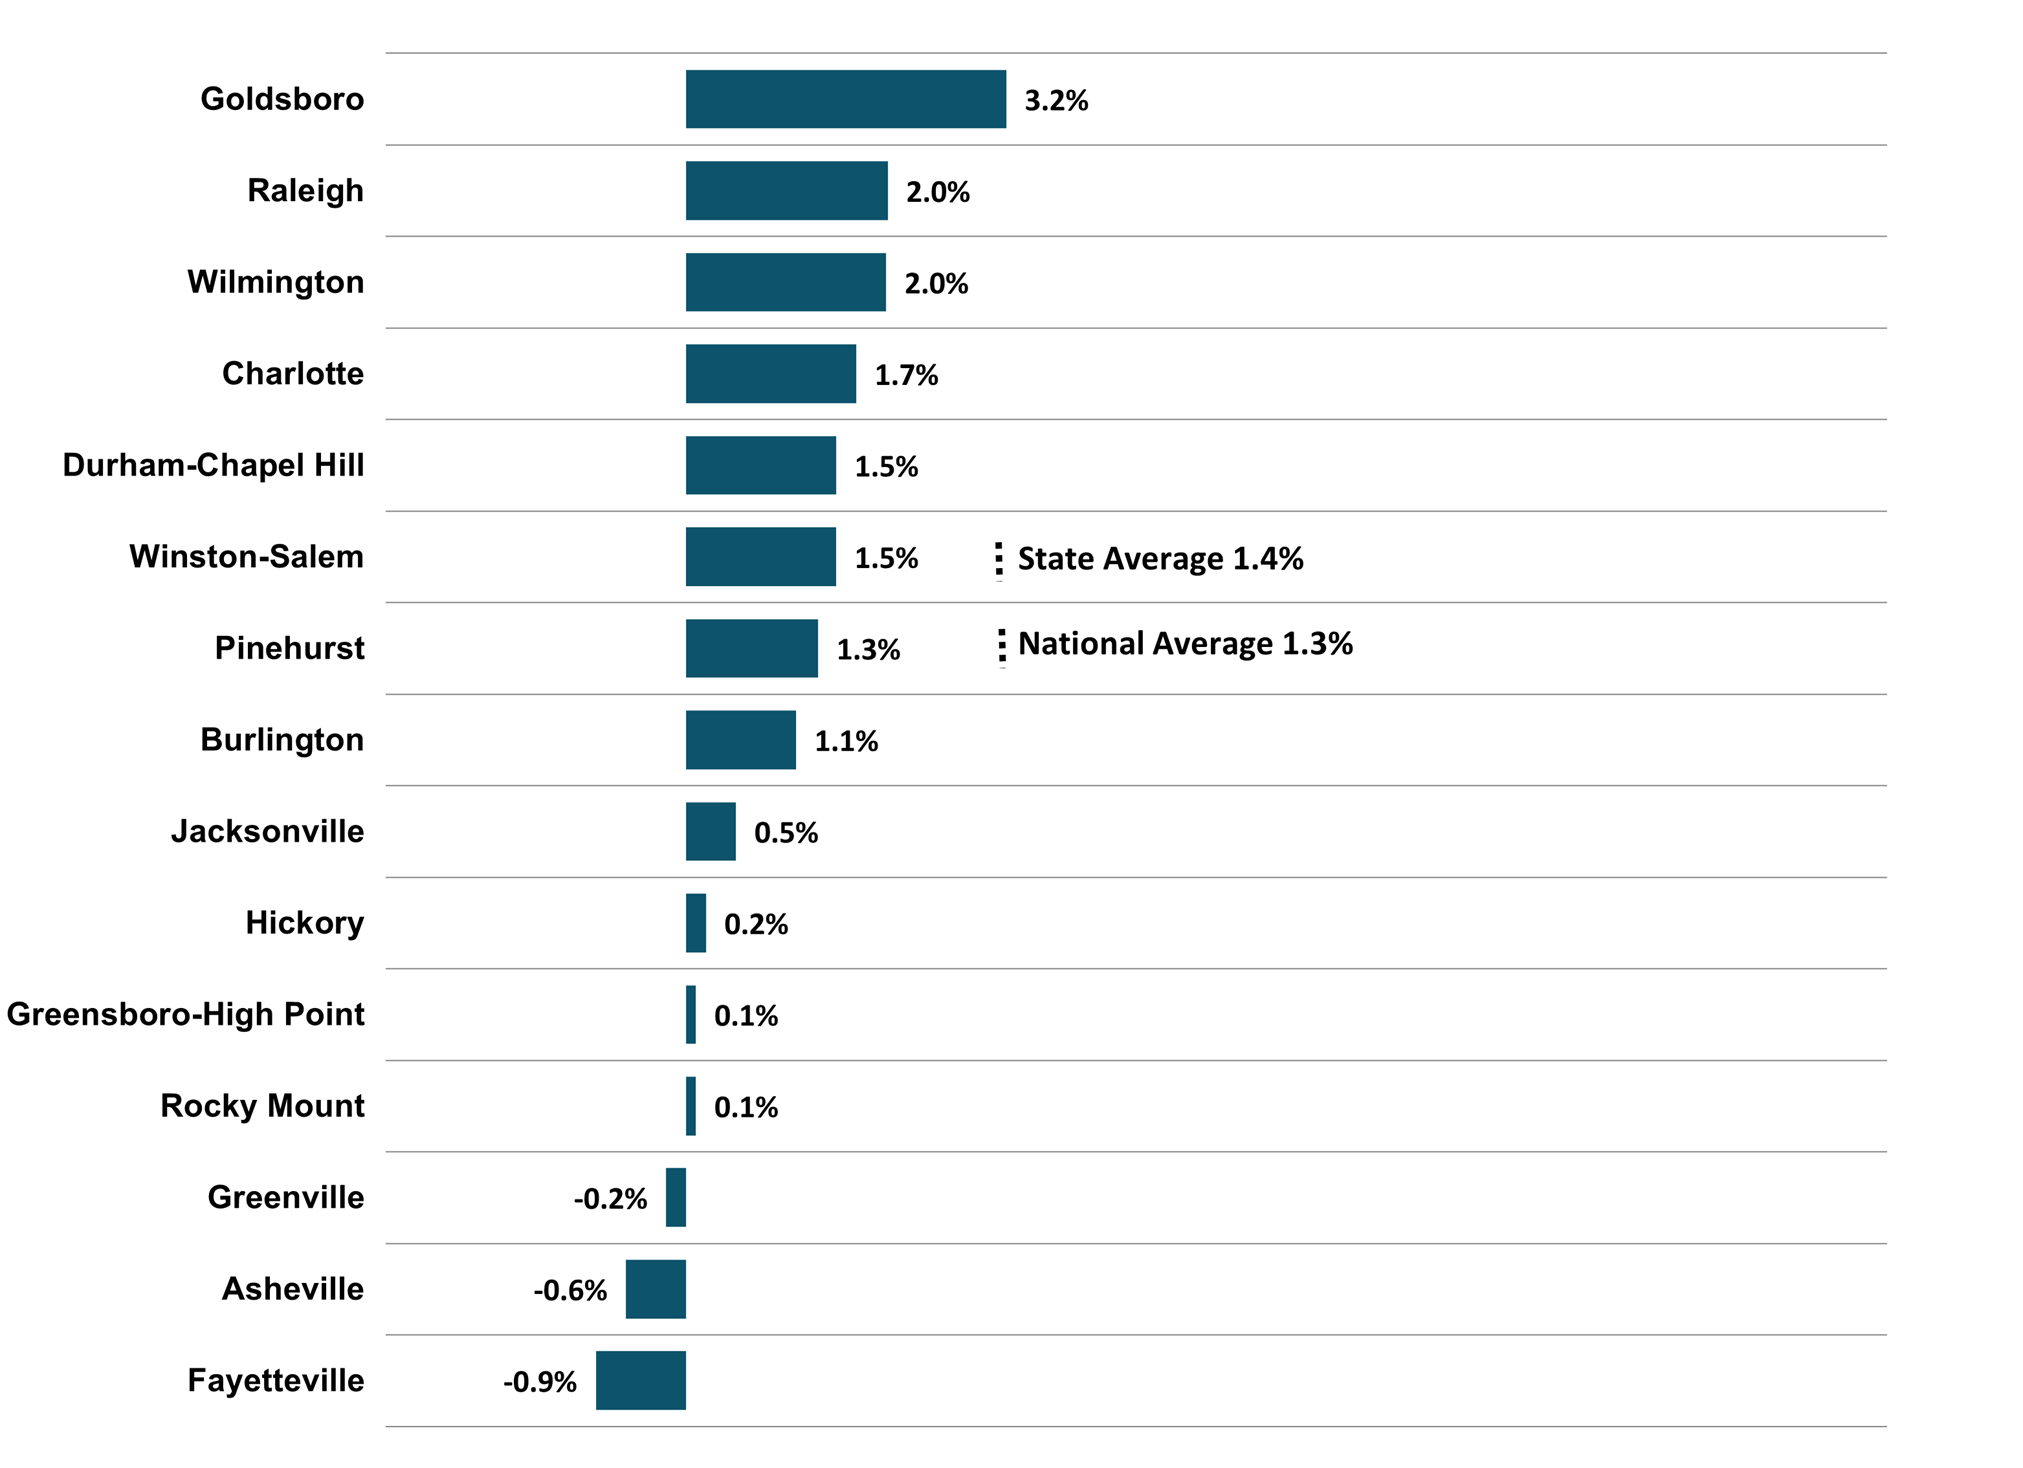
Among North Carolina’s fifteen metros, Raleigh (3.1 percent) and Durham-Chapel Hill (3.2 percent) recorded the lowest unemployment rates in the first quarter of 2025 (Figure 4). Ten metros reported unemployment rates at or below the state average of 3.8 percent. Only Fayetteville (4.7 percent), Rocky Mount (4.8 percent), and Asheville (5.4 percent) exceeded the national average of 4.4 percent, repeating a pattern seen in the previous quarter. Asheville was the only metro in the state with an unemployment rate above five percent.
Figure 4
North Carolina Metros
Unemployment Rate (%)
2025 1Q Average
 Source: US Bureau of Labor Statistics, Unemployment Rate by Metro, retrieved from Federal Reserve Bank of St. Louis
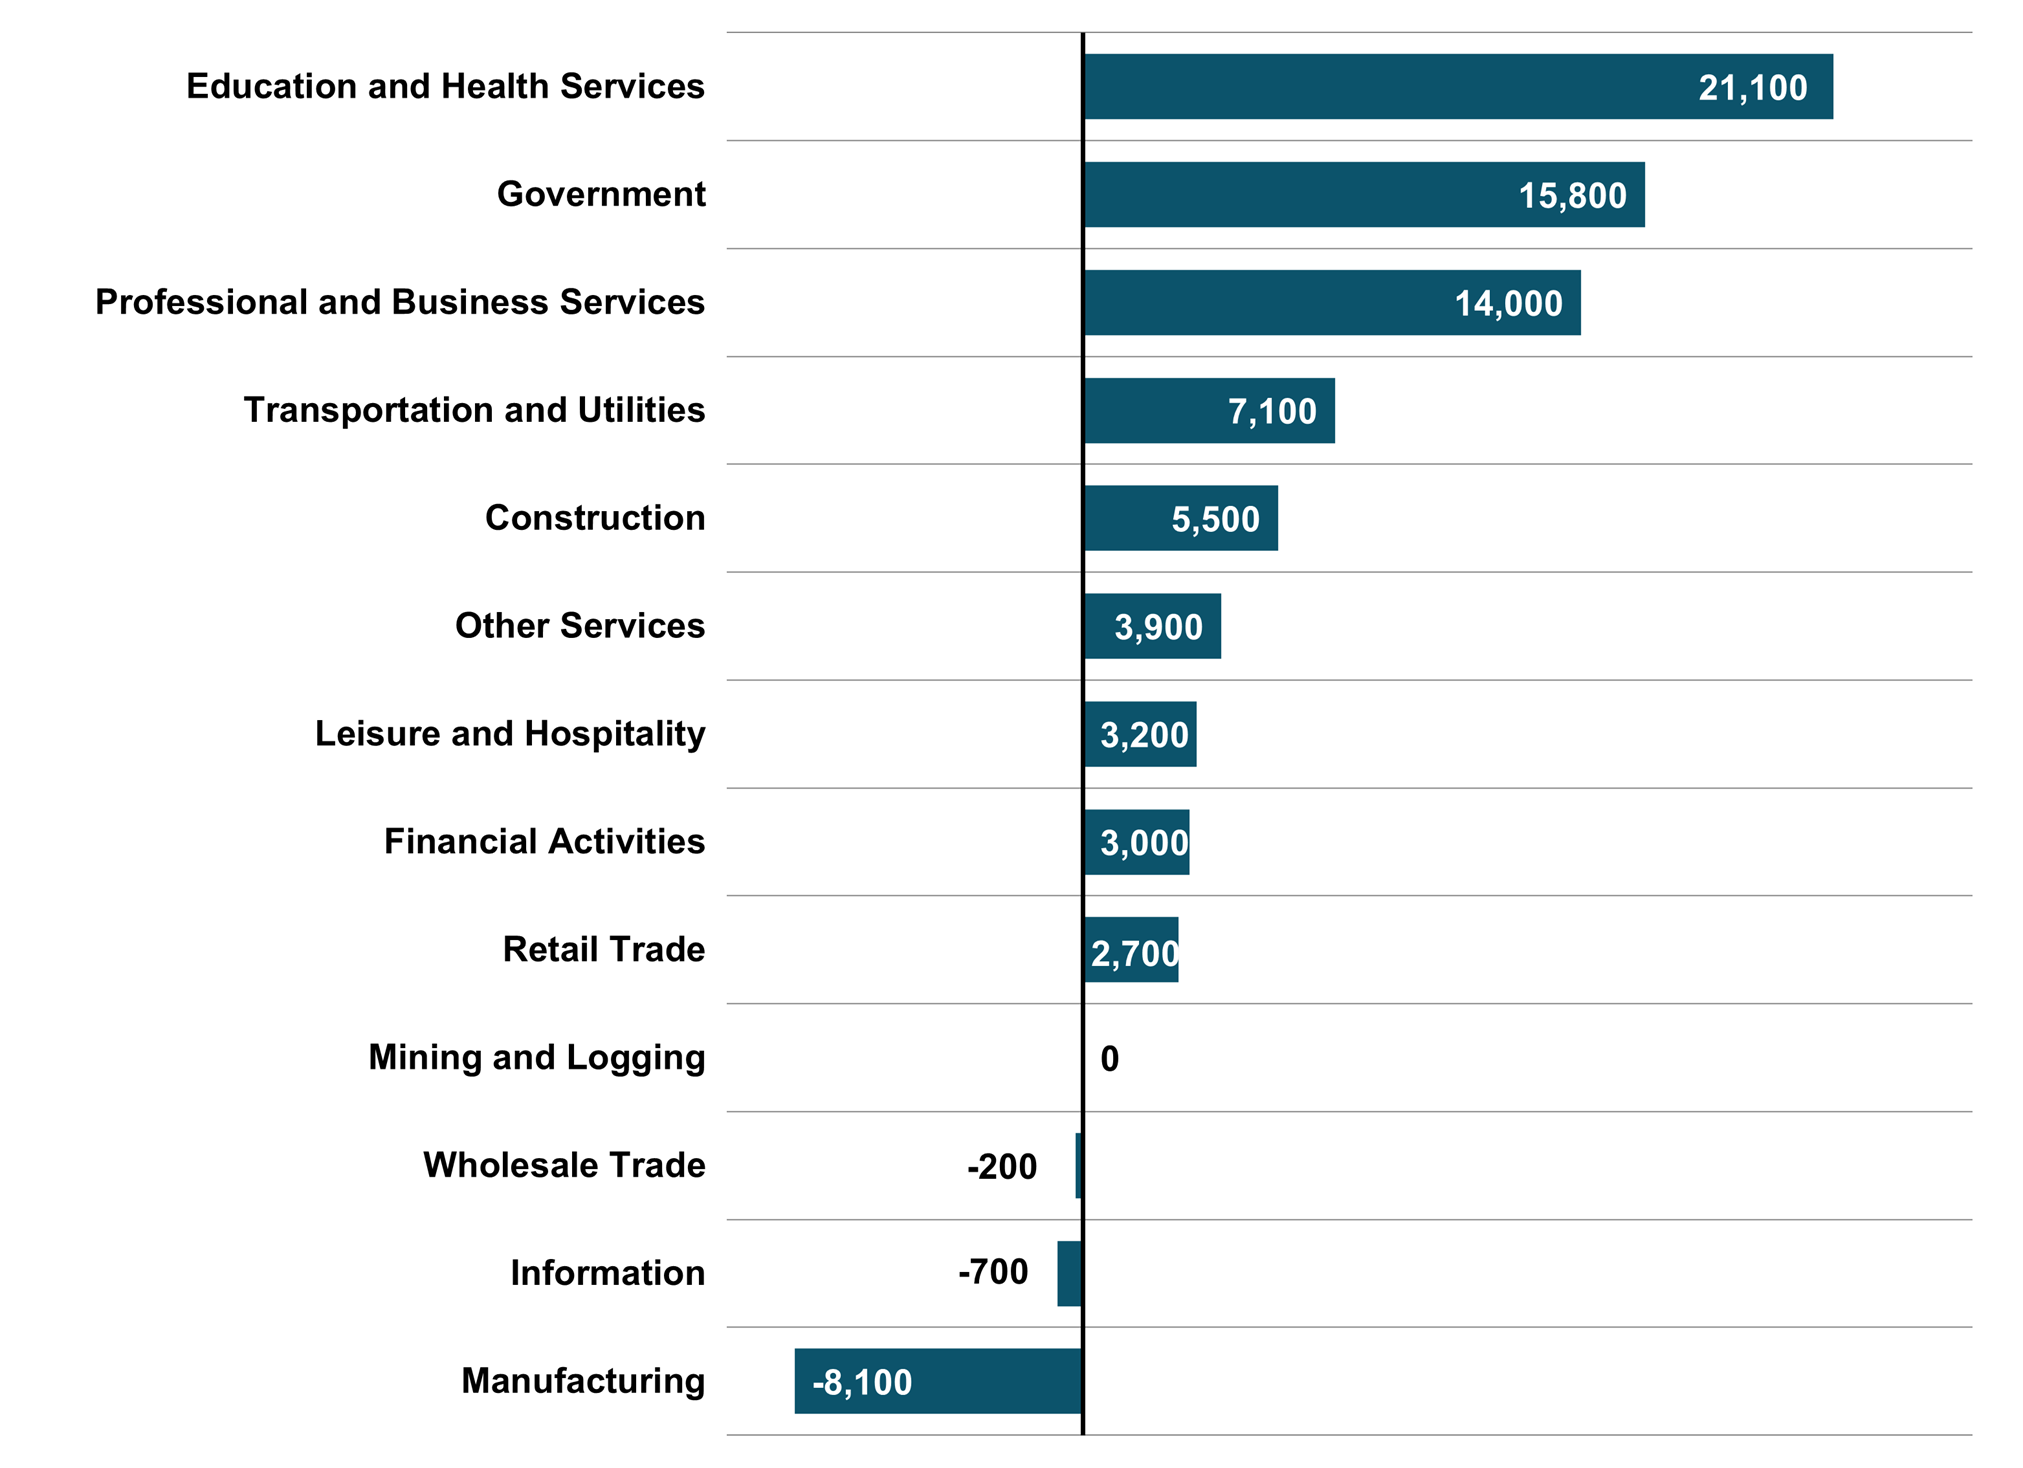
North Carolina added approximately 67,300 new jobs in the first quarter of 2025 compared to the same quarter a year earlier (Figure 5). This reflected a boost over the previous quarter but remained below the year-over-year gain of 88,000 jobs recorded in the first quarter of 2024.
Education and Health Services led job growth with an increase of 21,100 jobs, followed by Government, which added 15,800 jobs. Professional and Business Services moved up to the third fastest growing major industry with an estimated gain of 14,000 jobs year-over-year.
Only three of the state’s major industries recorded year-over-year losses. Manufacturing experienced the largest decline with a loss of 8,100 jobs, marking its eighth consecutive quarter of job loss; however, some of this decline may reflect shifts associated with advanced technology.
Figure 5
North Carolina – 2025 1Q
Major Industry Employment
One-Year Change
 Totals rounded to the nearest 100.
Source: US Bureau of Labor Statistics, All Employees by Major Industry in North Carolina, retrieved from Federal Reserve Bank of St. Louis
Wages
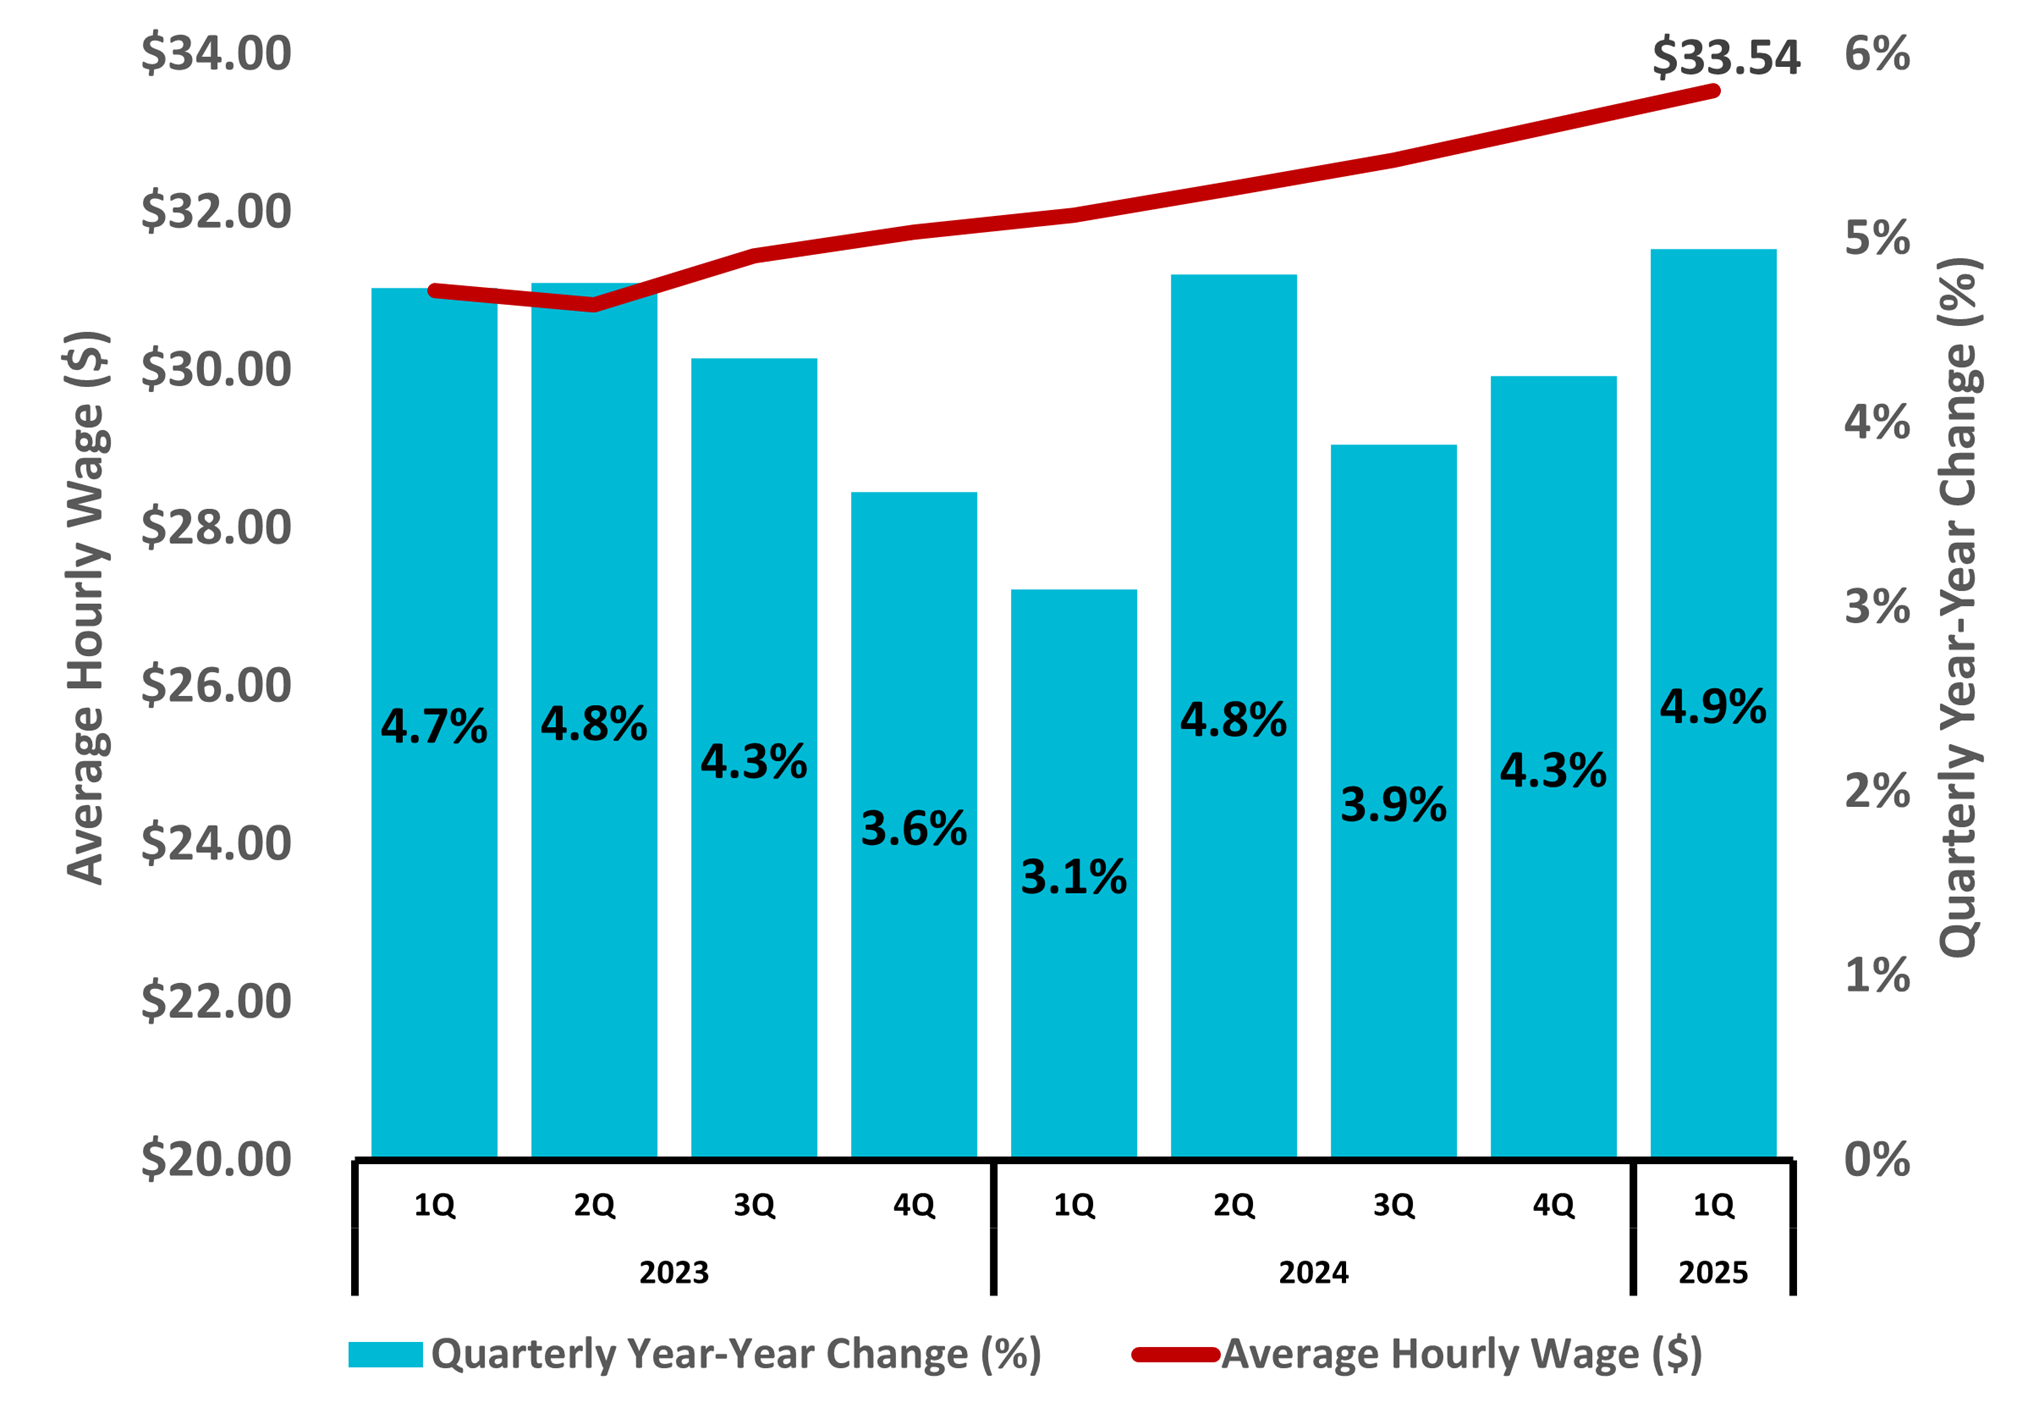
Average hourly wages in North Carolina continued an upward trend, reaching a record high of $33.54 in the first quarter of 2025 (Figure 6). This marked a 4.9 percent increase over the previous year and the fastest growth rate since the fourth quarter of 2022, when wages rose by 5.8 percent.
Figure 6
North Carolina
Average Hourly Wages
Private Industry
 Source: US Bureau of Labor Statistics and Federal Reserve Bank of St. Louis, Average Hourly Earnings of All Employees: Total Private in North Carolina
Charlotte continued to lead the state’s fifteen metro areas with an average hourly wage of $37.38 in the first quarter of 2025 (Figure 7). Raleigh followed this at $36.32 and Durham-Chapel Hill at $36.31. These three metros were the only areas to exceed both the state and national averages.
Eleven state metros saw wage increases from the previous quarter, though Charlotte, Asheville, Winston-Salem, and Goldsboro recorded declines.
Figure 7
North Carolina Metros – 2025 1Q
Average Hourly Wages
Private Industry
 Source: US Bureau of Labor Statistics and Federal Reserve Bank of St. Louis, Average Hourly Earnings of All Employees: Total Private by Metro, retrieved from Federal Reserve Bank of St. Louis
Housing
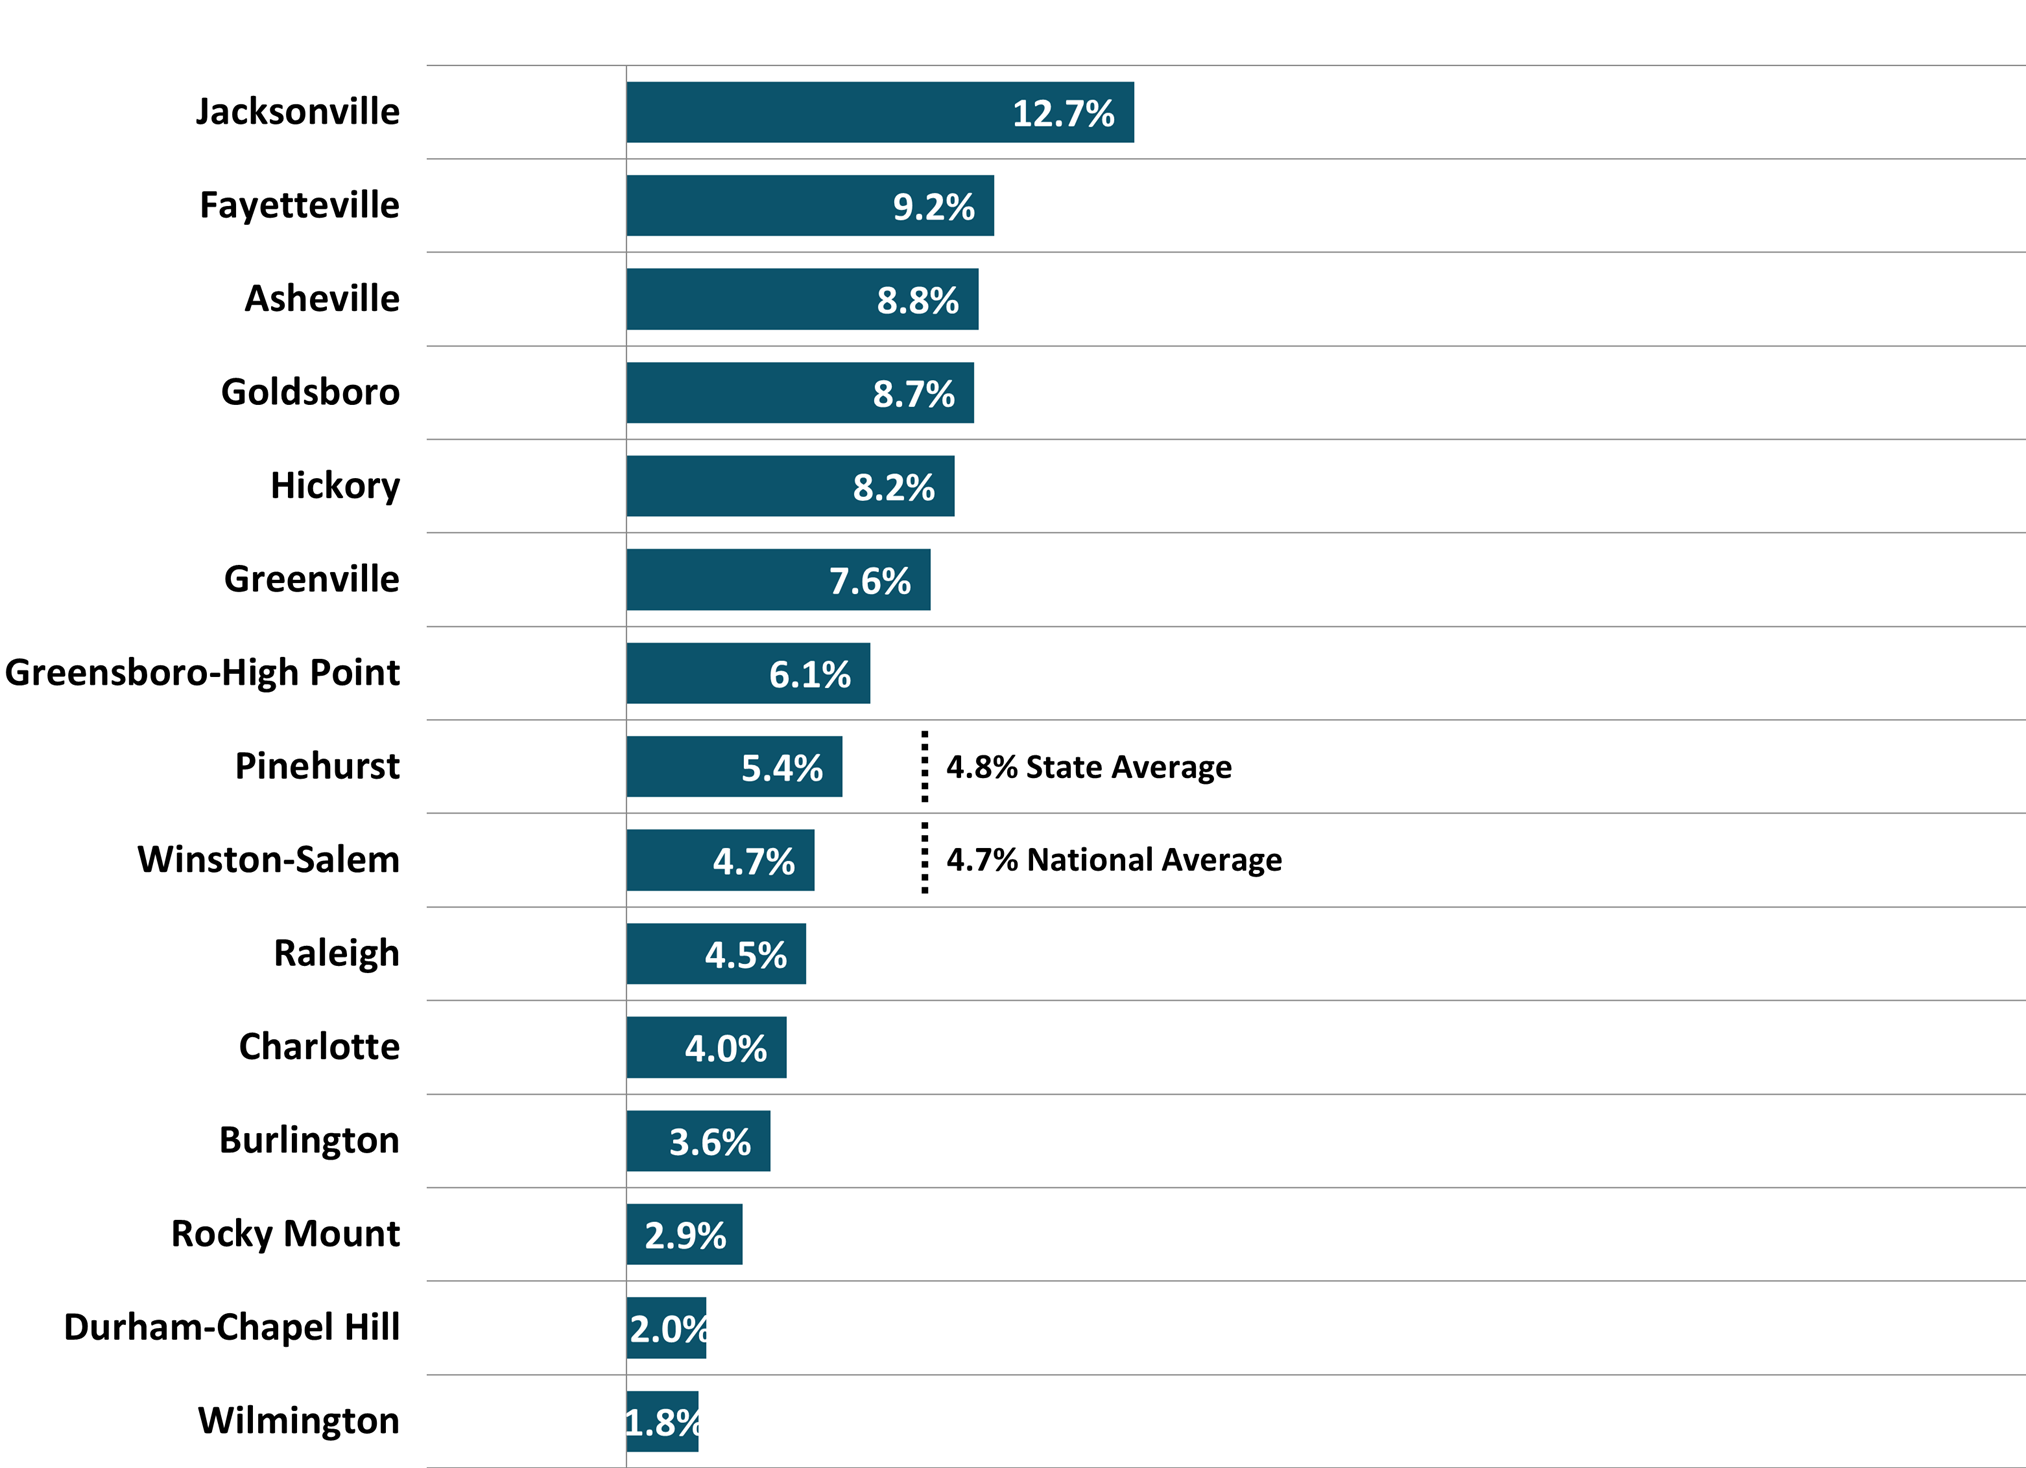
North Carolina’s annual house price appreciation rate was 4.8 percent in the first quarter of 2025, slightly above the national rate of 4.7 percent for the same period (Figure 8). The Jacksonville metro led the state’s fifteen metros with a 12.7 percent increase, while Wilmington posted the slowest growth at 1.8 percent. Eight metros exceeded both the state and national rates, and none experienced a decline.
Figure 8
North Carolina Metros
Annual Appreciation Rate (%)
2025 1Q
 Source: US Federal Housing Finance Agency, All-Transactions House Price Index, retrieved from Federal Reserve Bank of St. Louis
Permit activity for new residential buildings in North Carolina totaled 23,419 units in the first quarter of 2025, with a value of $5,678,043,000 (Figure 9). This represented an increase of 0.6 percent in the number of units permitted compared to the previous year, while the total value decreased by 4.8 percent. Multi-family units accounted for 6,081 permits, or approximately 26 percent of units permitted.
Figure 9
North Carolina
Estimated Residential Building Permits Activity*
 *Based on a survey of permitting agencies. The Census Bureau estimates
any missing agency data, which typically amounts to less than 20% of the total permits.
Source: US Census Bureau
Retail Sales
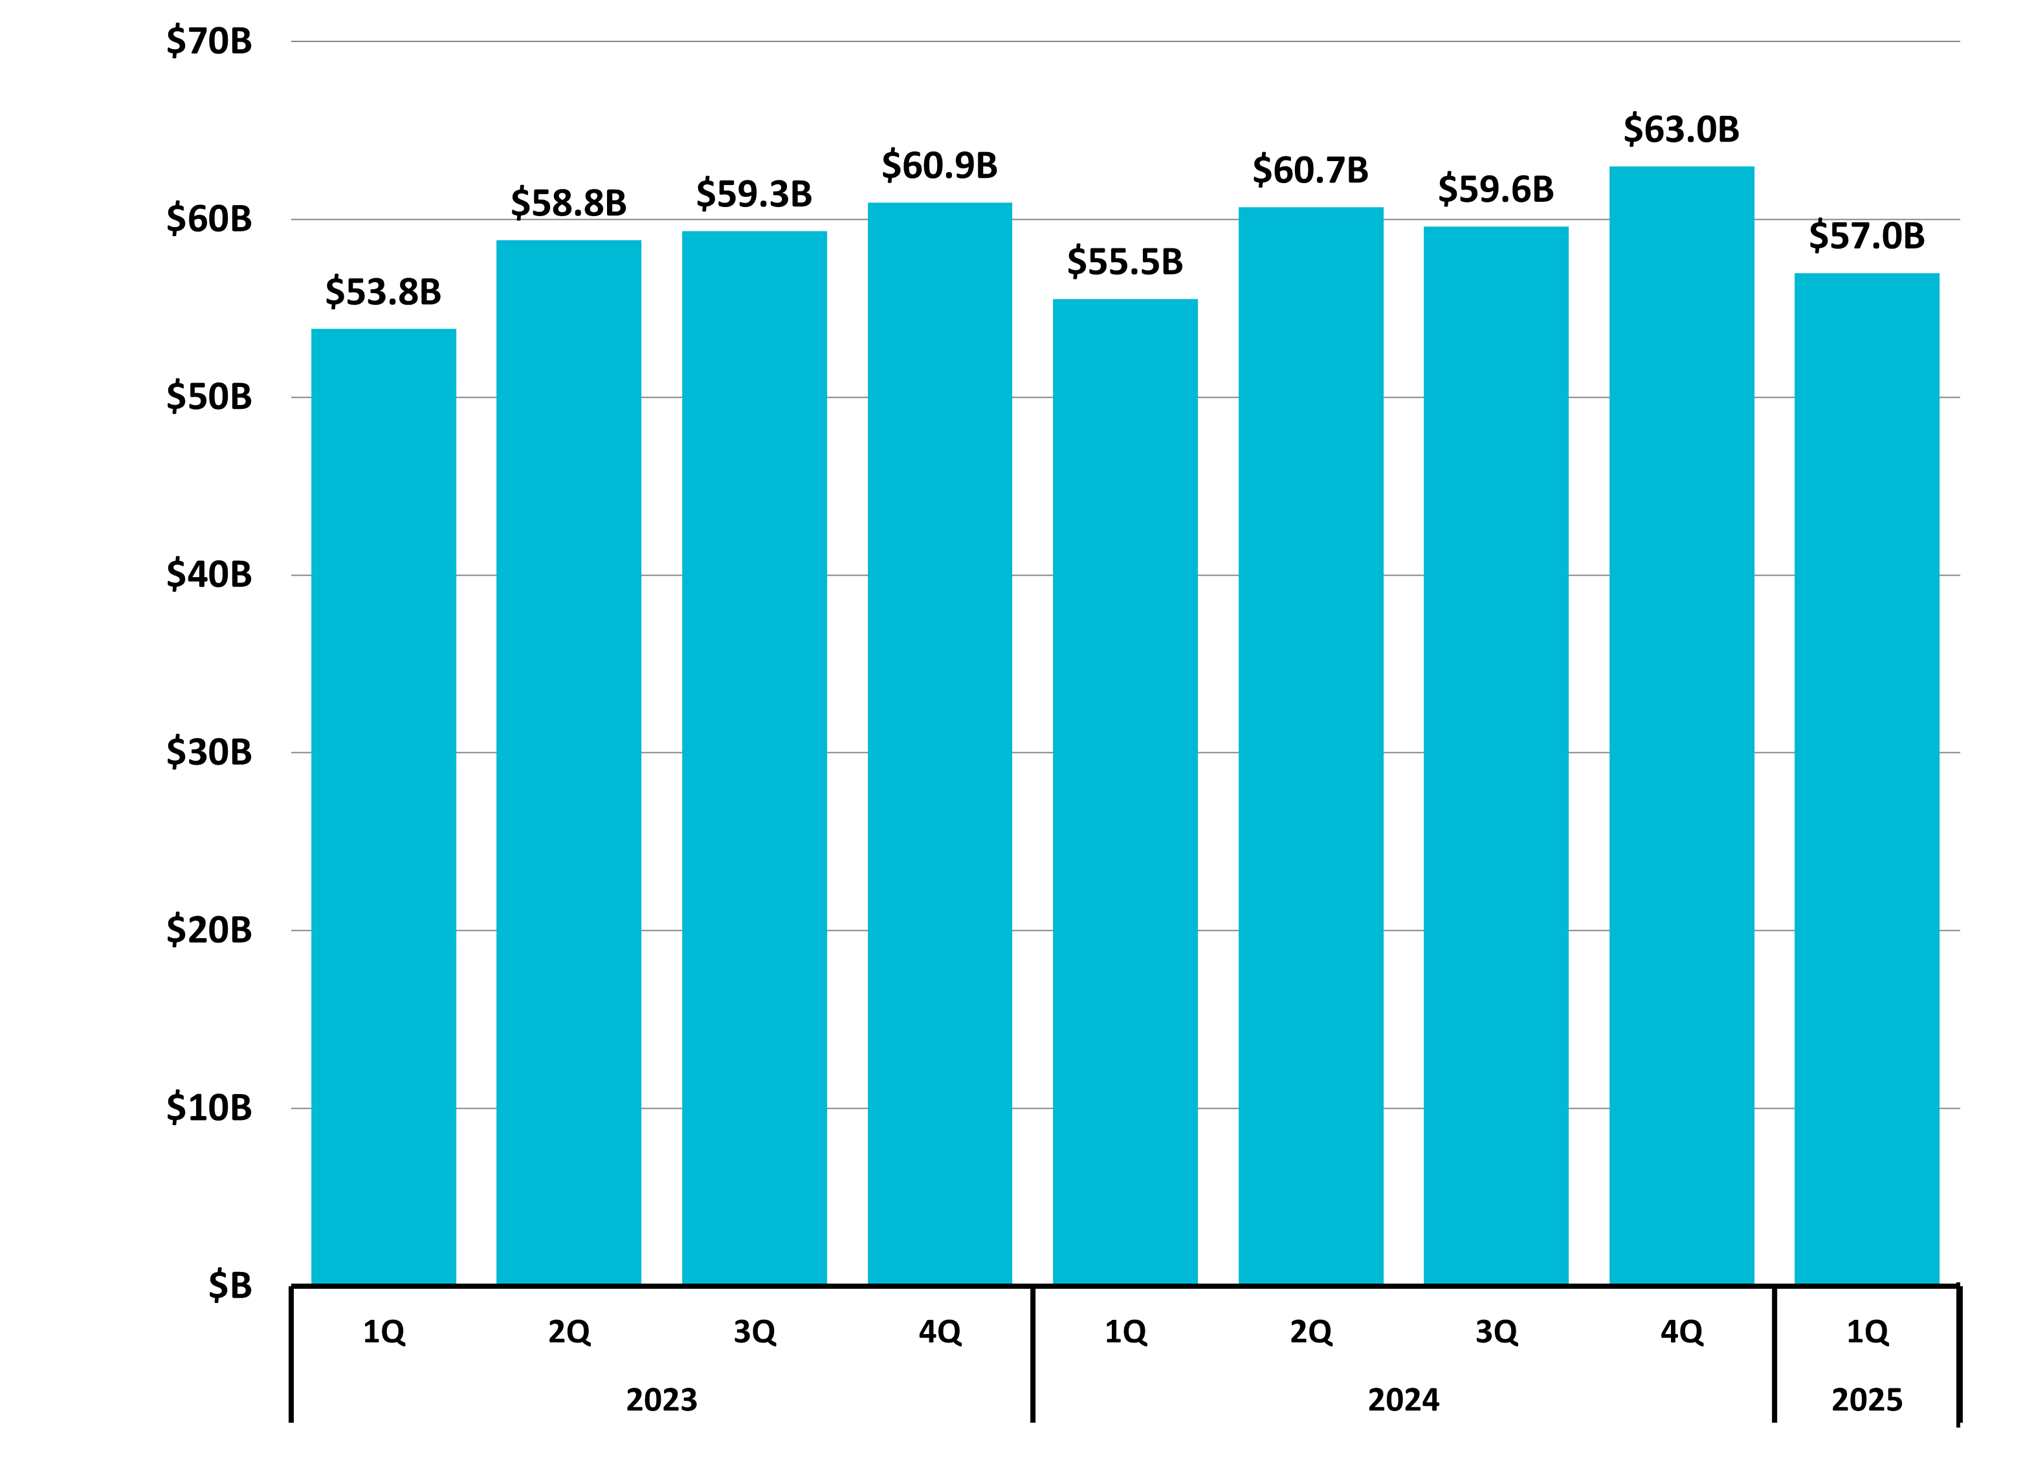
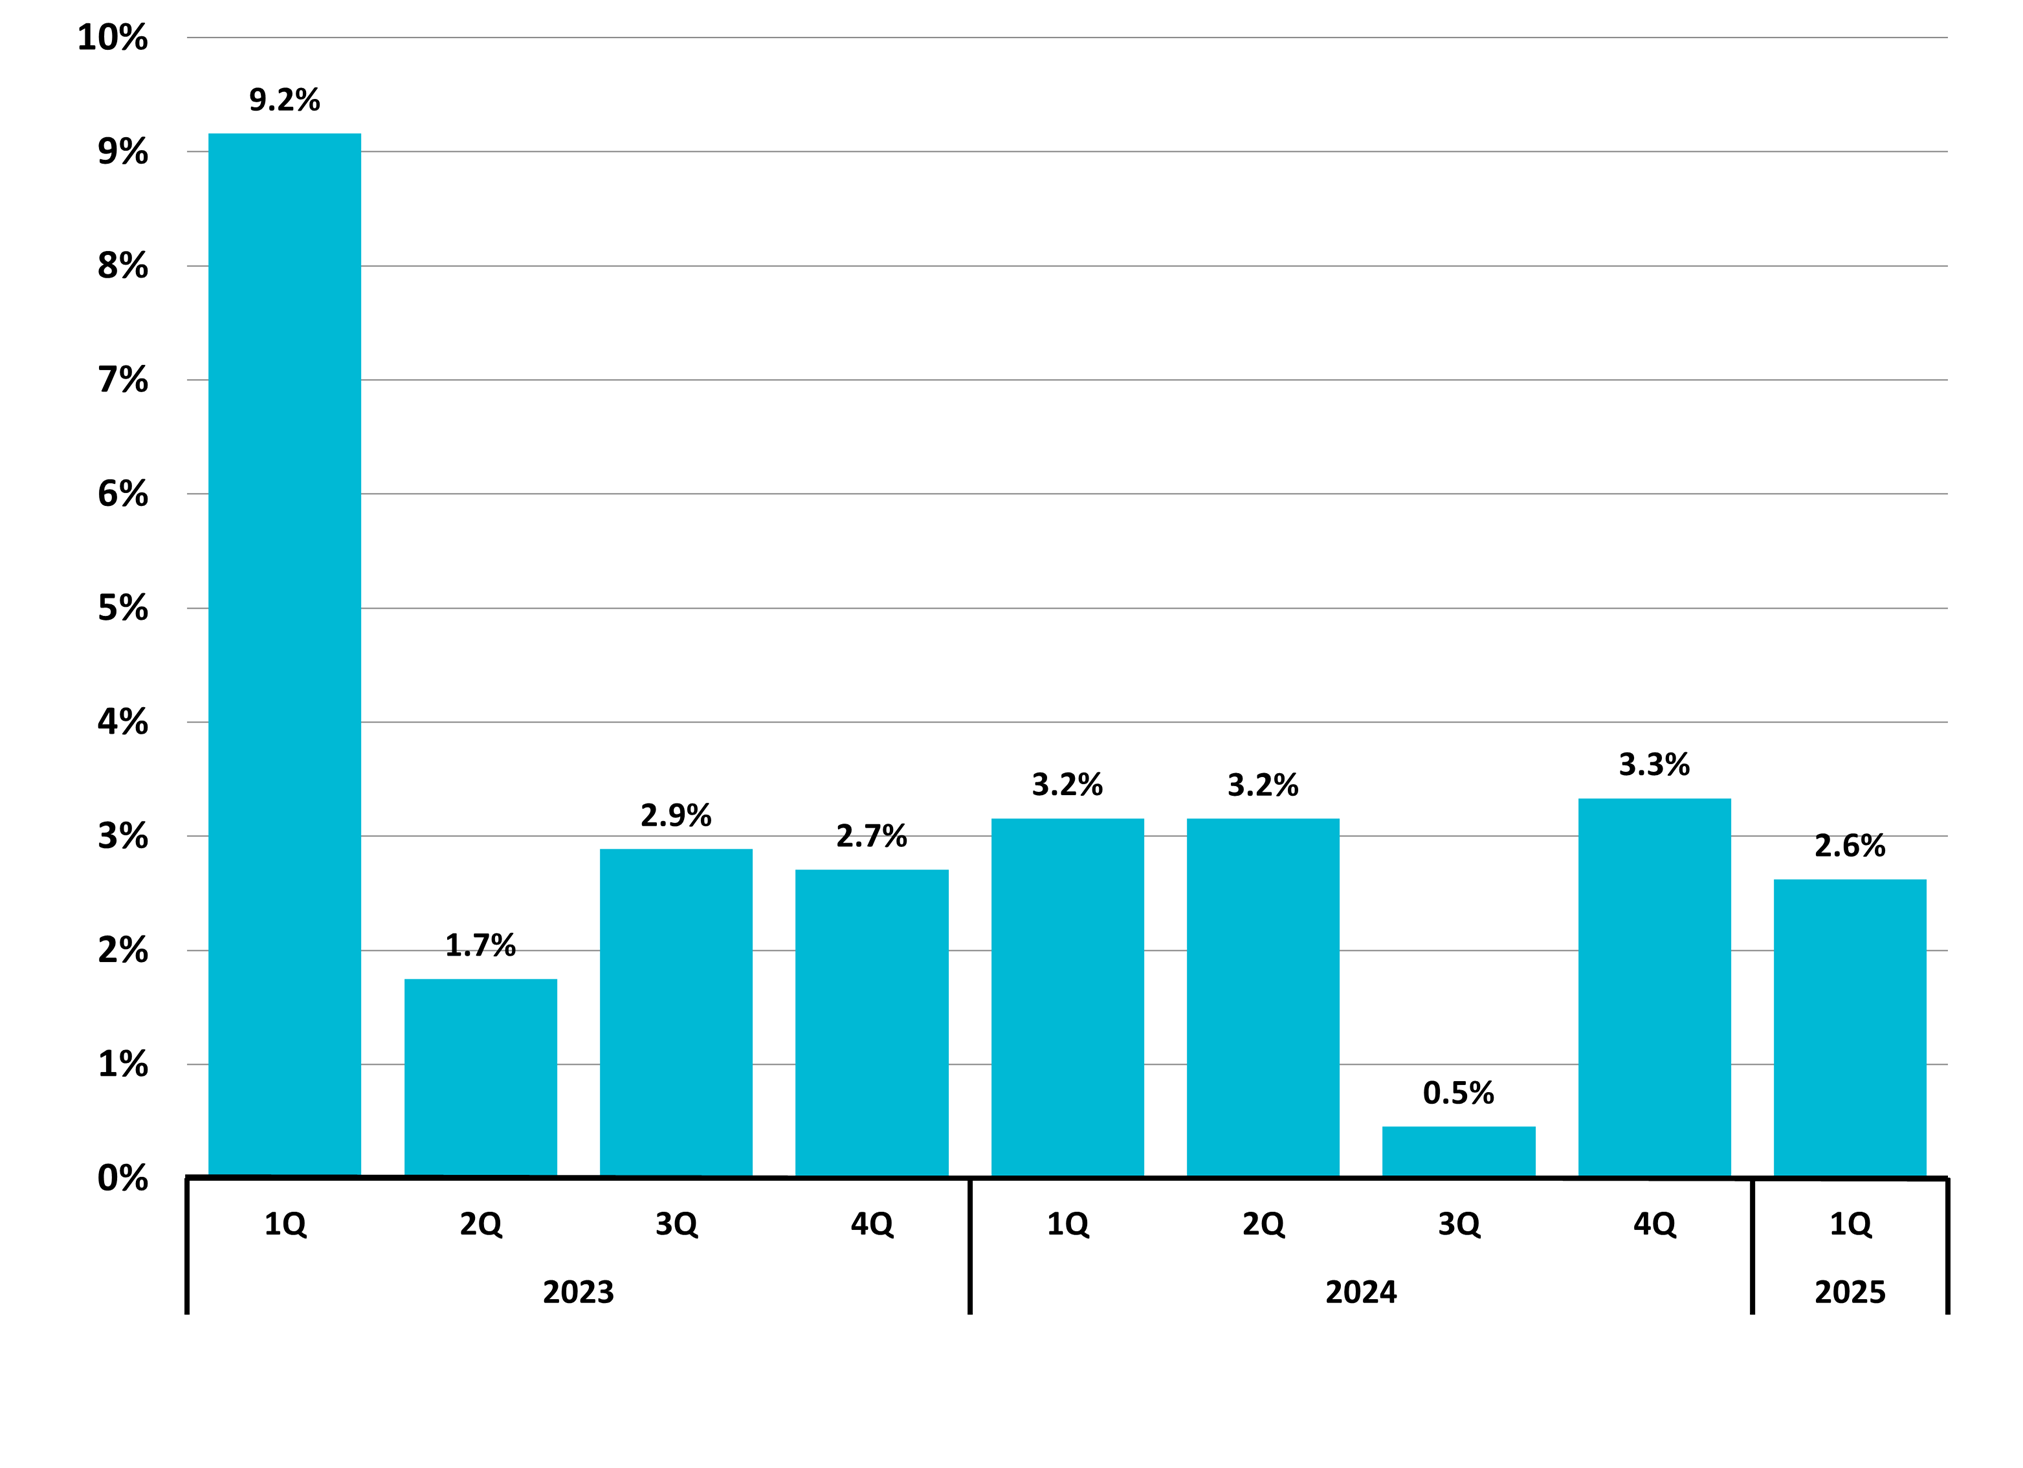
Taxable retail sales in North Carolina totaled $56,988,638,203 ($57 billion) in the first quarter of 2025 (Figure 10), a modest 2.6 percent increase compared to the same quarter in 2024 (Figure 11). Each first quarter since 2020 has shown an increase in taxable retail sales.
Figure 10
North Carolina
Total Taxable Retail Sales
 Includes collections of penalties, interest, and sales & use tax; and may reflect activity from prior periods.
Source: NC Department of Revenue
Figure 11
North Carolina
Total Taxable Retail Sales
Quarterly Year-to-Year Change (%)
 Includes collections of penalties, interest, and sales & use tax; and may reflect activity from prior periods.
Source: NC Department of Revenue
Special Feature:
Health Insurance Coverage Status
In 2023, the United States Census Bureau estimated 9.2 percent of North Carolina’s civilian noninstitutionalized population lacked health insurance coverage (Figure 12). This placed the state 29th out of 37 distinct state rates. While still above the national rate of 7.9 percent, the figure represents a substantial improvement from 2013, when an estimated 15.6 percent of the state’s population was uninsured.
Figure 12
Uninsured Rate by State
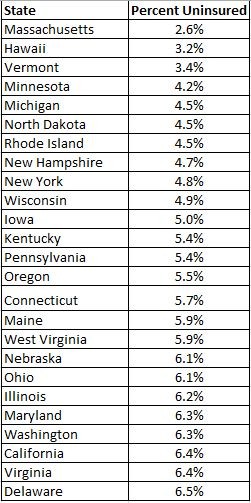
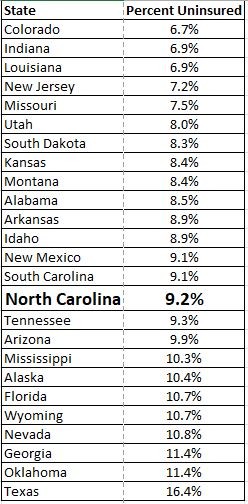
Source: US Census Bureau, American Community Survey, 1-Year Estimates
Update on Metropolitan Statistical Area Delineation Changes:
The first quarter 2025 report reflects revisions to metropolitan statistical area delineations (MSAs or metros) in North Carolina, as defined by the Office of Management and Budget (OMB). These changes include the following:
- The New Bern metro has been redesignated as a Micropolitan Statistical Area.
- Moore County now constitutes the new Southern Pines–Pinehurst metro area.
- The Asheville metro no longer includes Haywood County and consists of Buncombe, Henderson, and Madison counties.
- Anson County has been added to the Charlotte-Concord-Gastonia metro area.
- Brunswick County has been added to the Wilmington metro area.
OMB Metropolitan Statistical Areas*

* Not included: Virginia Beach-Chesapeake-Norfolk MSA
Source: NC Department of Commerce
The business landscape is complex. Need help? Contact DMJPS.
For a printer-friendly version, click here.