

Highlights:
DMJPS is pleased to provide the second quarter 2026 economic update across North Carolina’s fifteen metro areas. The state continued to add jobs, with employment gains extending across most metros. Other indicators presented a varied picture: unemployment remained relatively low even as the labor force contracted, while wage growth slowed.
- In the second quarter of 2026, North Carolina’s employment averaged 5,126,200 jobs, up 1.1 percent year-over-year and marking the highest quarterly employment level to date.
- Employment increased year-over-year in ten of the state’s fifteen metros, led by Raleigh at 2.3 percent.
- By major industry, Education and Health Services continued to lead job growth, adding 20,900 jobs, while Manufacturing declined by 11,200 jobs.
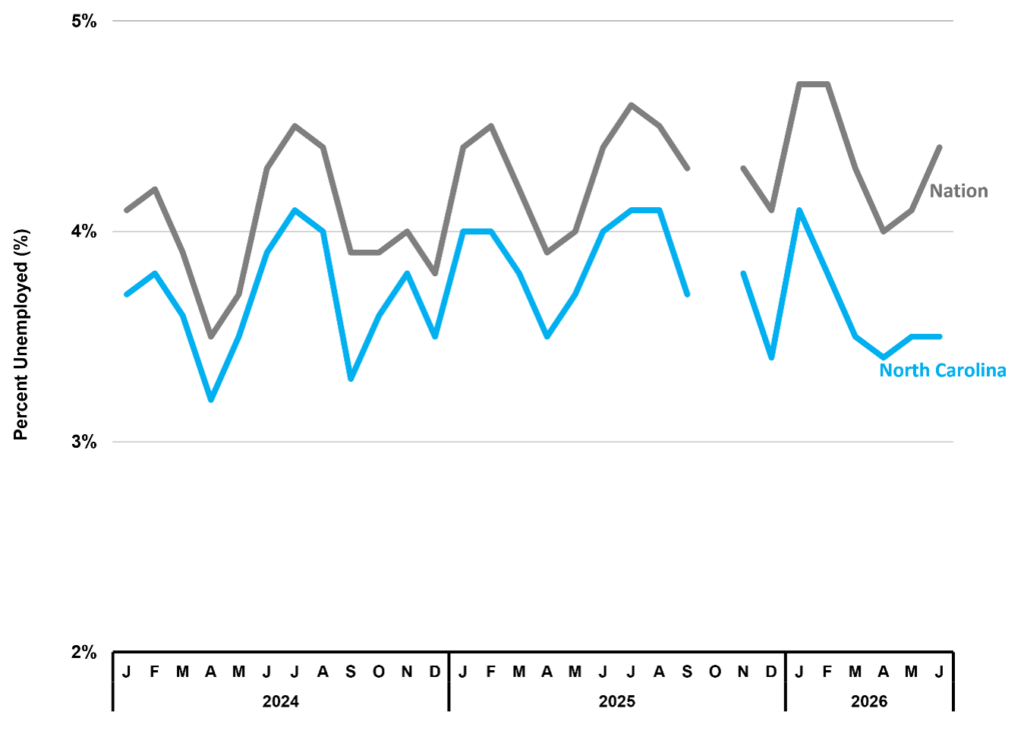
- North Carolina’s unemployment rate averaged 3.5 percent, compared with 4.2 percent nationally, although the state’s labor force contracted compared to the previous year.
- The state’s second quarter average hourly wage was $34.64, with year-over-year wage growth slowing to 2.9 percent, the lowest rate since the first quarter of 2020.
- North Carolina’s annual house price appreciation rate was 2.4 percent, compared with 3.0 percent nationally.
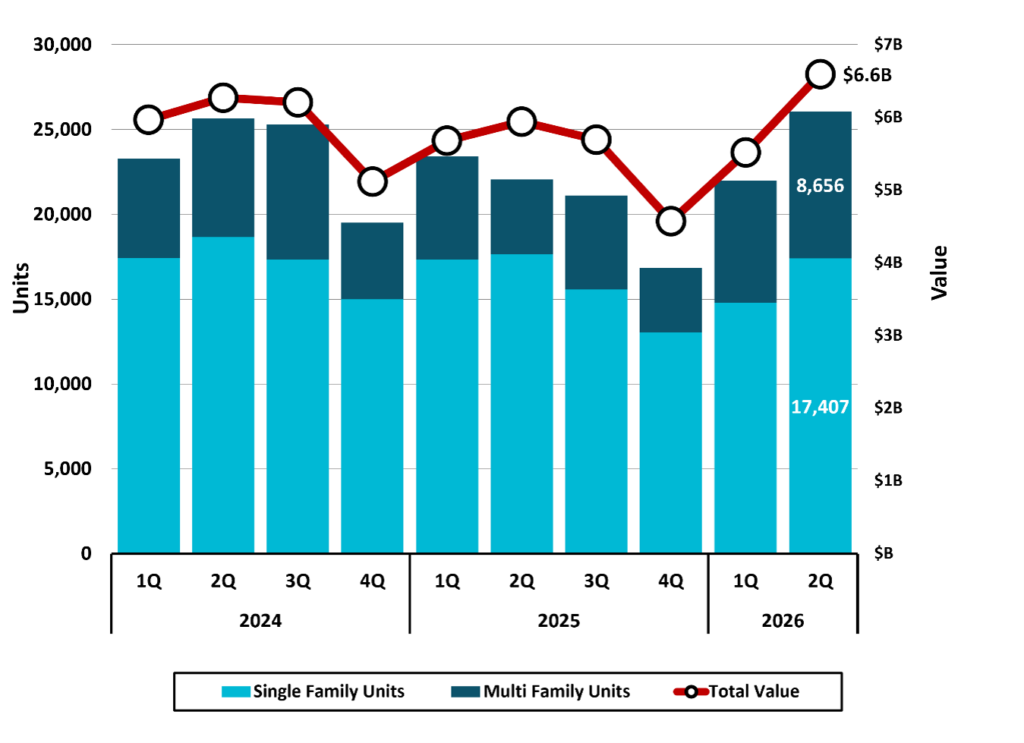
- Residential building permits totaled 26,063 units, up 18.2 percent year-over-year, with multi-family units nearly doubling from a year earlier.
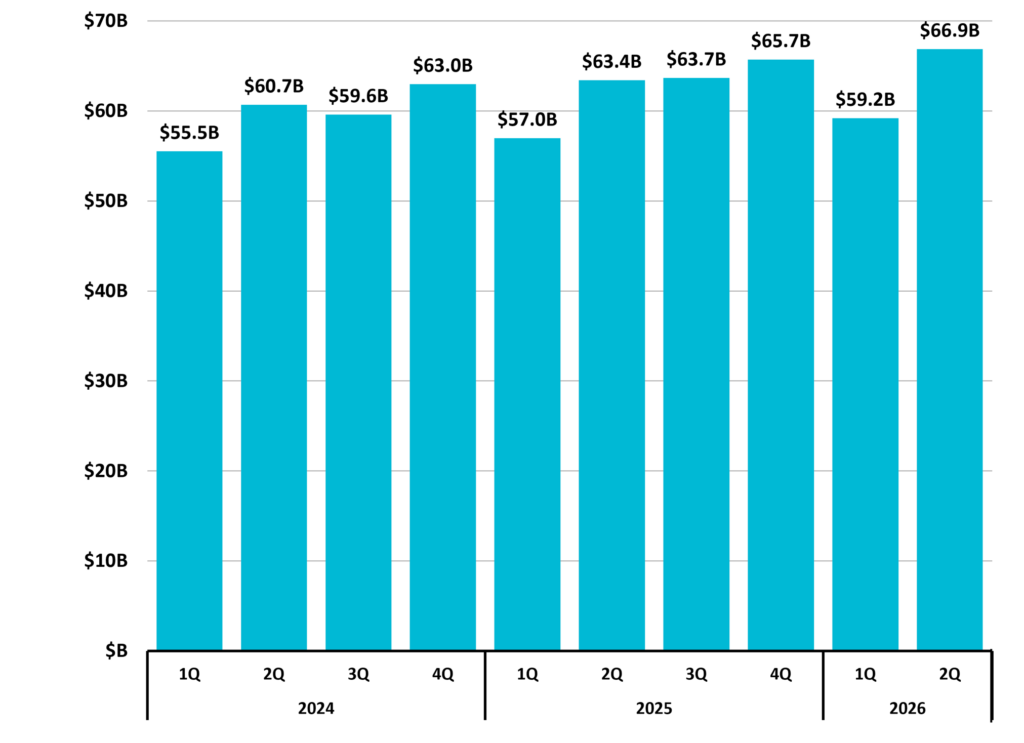
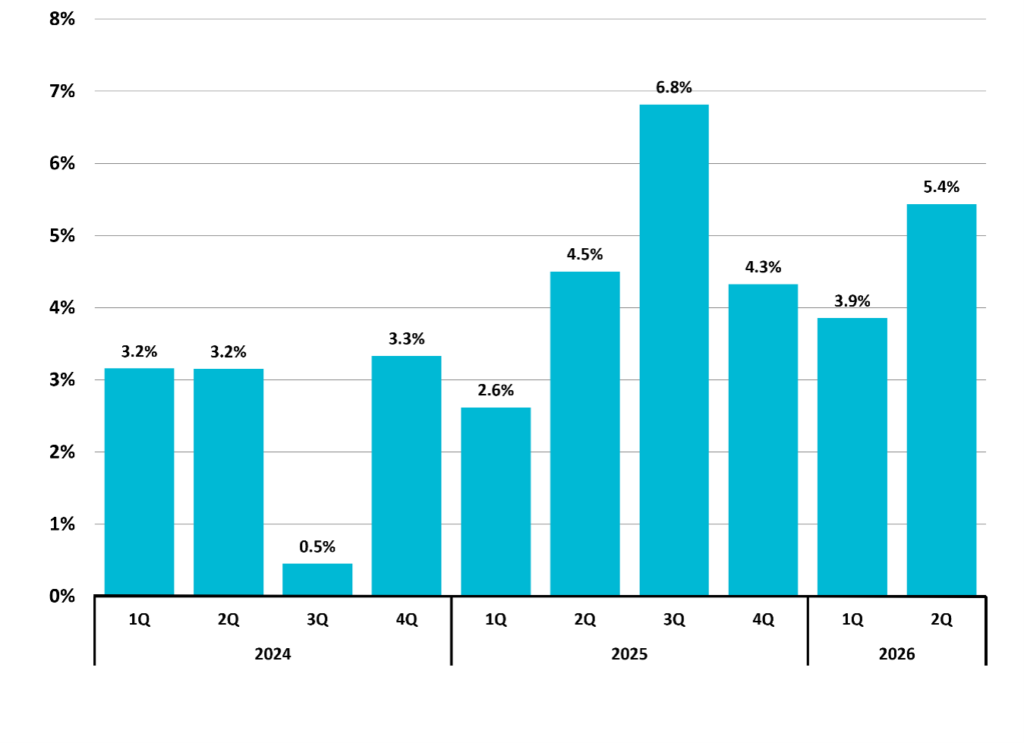
- Taxable retail sales totaled $66.9 billion, up 5.4 percent year-over-year.
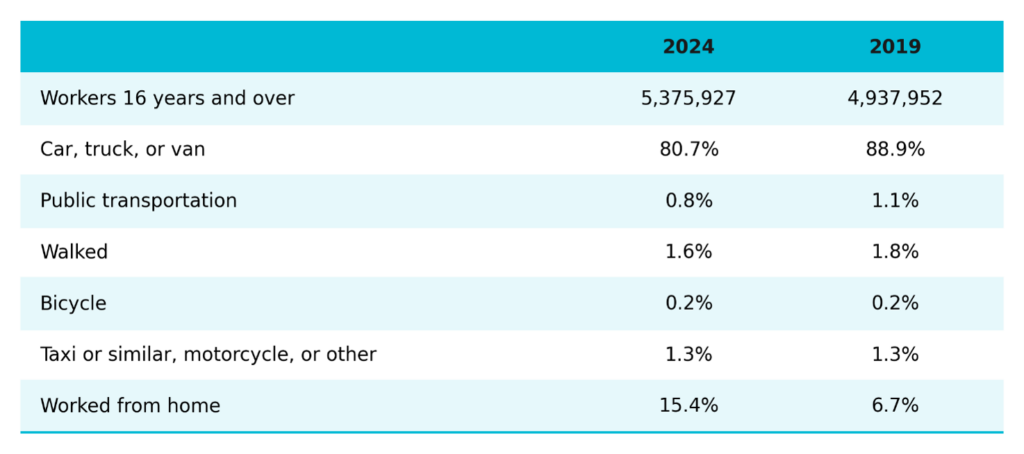
- Special feature – North Carolina Means of Transportation to Work: The share of workers who worked from home increased from 6.7 percent in 2019 to 15.4 percent in 2024.
Detailed Analysis: Employment
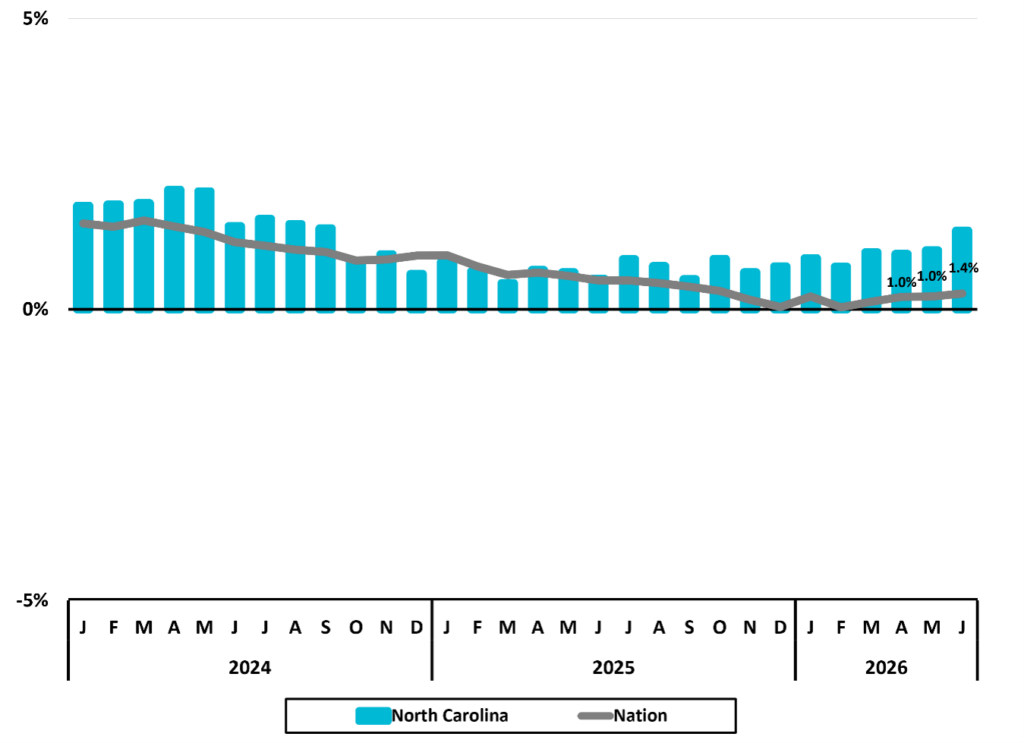
In the second quarter of 2026, North Carolina’s employment averaged 5,126,200 jobs, a 1.1 percent increase year-over-year (Figure 1). This marked the highest quarterly employment level to date, with growth exceeding the national rate of 0.2 percent. Monthly data show year-over-year growth picking up toward the end of the second quarter.
Figure 1 North Carolina Total Nonfarm Employment Monthly Year-to-Year Percent Change
 Source: US Bureau of Labor Statistics
Employment growth was positive across the majority of North Carolina’s metropolitan areas in the second quarter of 2026 (Figure 2). Ten of the state’s fifteen metros added jobs year-over-year, one was unchanged, and four experienced declines. Five metros exceeded the state’s overall 1.1 percent rate, with Raleigh posting the strongest gain at 2.3 percent and Fayetteville the largest decline at 1.2 percent.
Figure 2 2026 2Q Average North Carolina Metros Employment One-Year Percent Change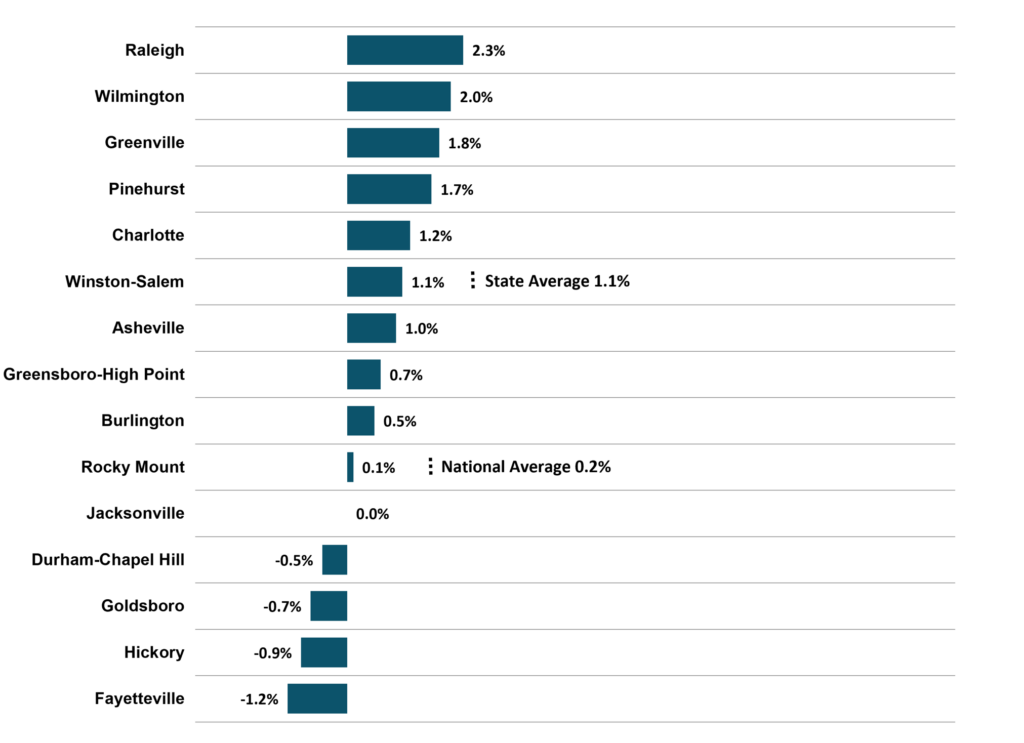 Source: US Bureau of Labor Statistics
North Carolina’s unemployment rate averaged 3.5 percent in the second quarter, compared with 4.2 percent nationally (Figure 3). The number of unemployed averaged 182,927, a decline of 7.3 percent from the same quarter a year earlier. However, the state’s labor force, defined as people either employed or actively looking and available for work, contracted by 1.0 percent. The data do not indicate why it contracted, and people may leave the labor force for a variety of reasons, but the decline is important context for the state’s relatively low unemployment rate.
Figure 3 North Carolina Unemployment Rate (%)
Source: NC Department of Commerce
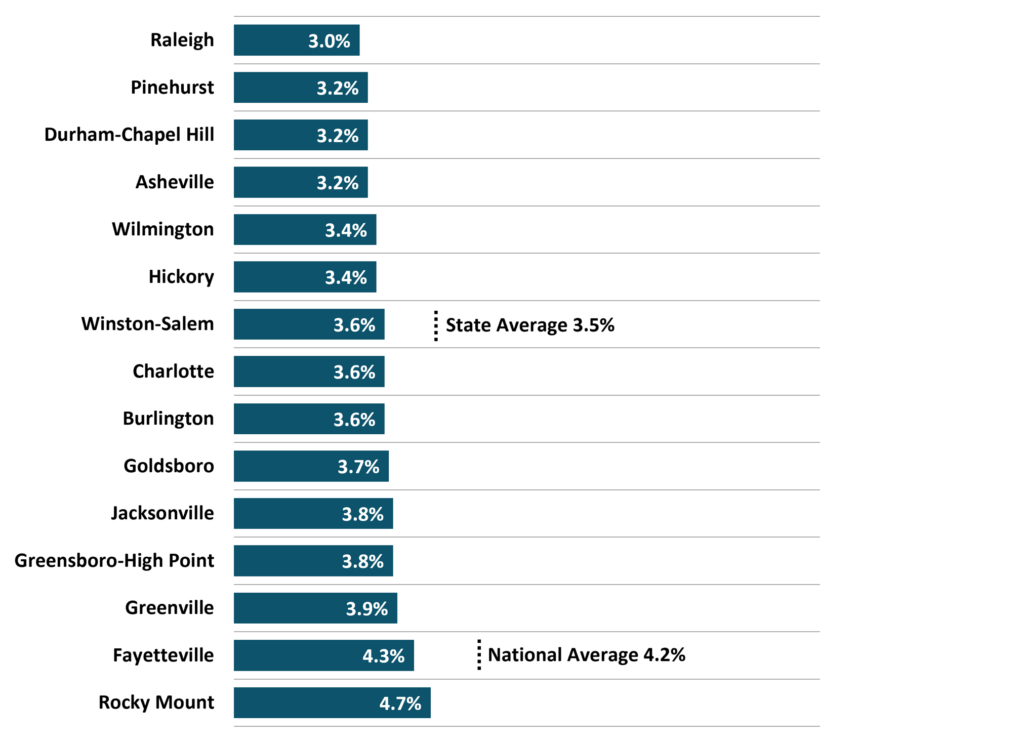
Among North Carolina’s fifteen metropolitan areas, the Raleigh metro had the lowest unemployment rate at 3.0 percent in the second quarter (Figure 4). Pinehurst, Durham-Chapel Hill, and Asheville followed, each at 3.2 percent. Rocky Mount (4.7 percent) had the highest rate, followed by Fayetteville (4.3 percent), and both exceeded the national average of 4.2 percent. Overall, unemployment rates ranged from 3.0 percent to 4.7 percent.
Figure 4 North Carolina Metros Unemployment Rate (%) 2026 2Q Average
 Source: NC Department of Commerce
North Carolina added approximately 56,100 jobs year-over-year in the second quarter of 2026 (Figure 5). The state has recorded year-over-year quarterly job growth since the second quarter of 2021 (21 consecutive quarters). By major industry, Education and Health Services continued to lead job growth, adding 20,900 jobs. Construction (+14,200) and Professional and Business Services (+11,400) followed. Only two major industries recorded year-over-year employment losses: Information (-3,000) and Manufacturing (-11,200). For Manufacturing, the year-over-year decline eased slightly from the previous quarter.
Figure 5 North Carolina – 2026 2Q Major Industry Employment One-Year Change
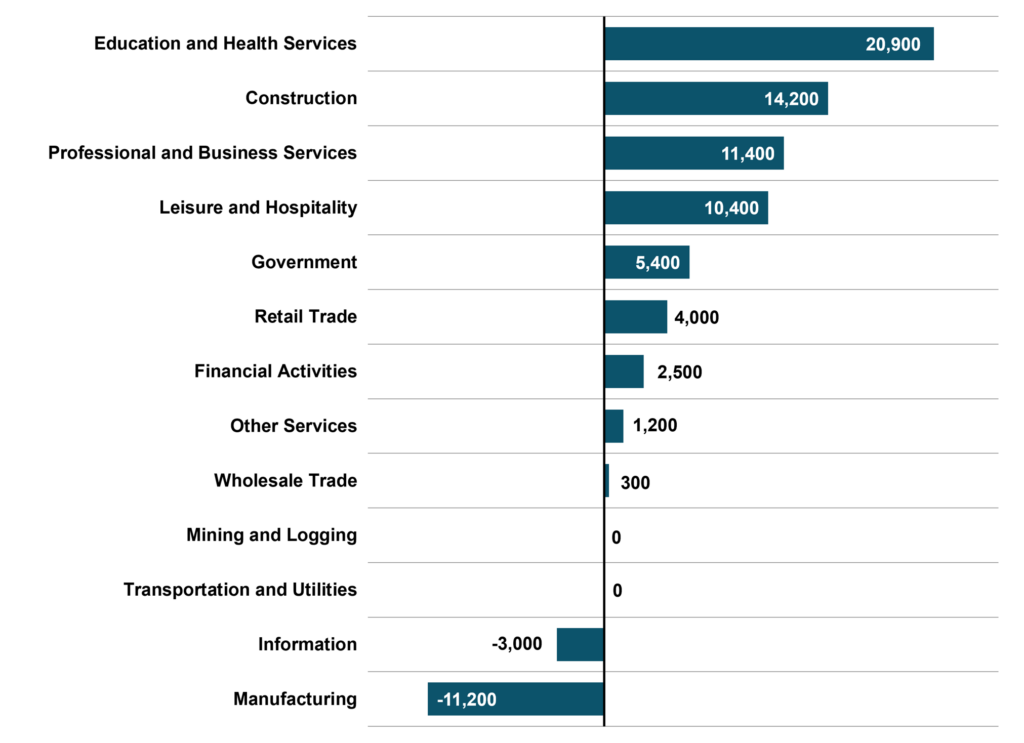 Totals rounded to the nearest 100. Source: US Bureau of Labor Statistics
Wages
North Carolina’s average hourly wage dipped from the previous quarter to $34.64 in the second quarter of 2026 (Figure 6). Year-over-year wage growth slowed to 2.9 percent, the lowest rate since the first quarter of 2020.
Figure 6 North Carolina Average Hourly Wages Private Industry
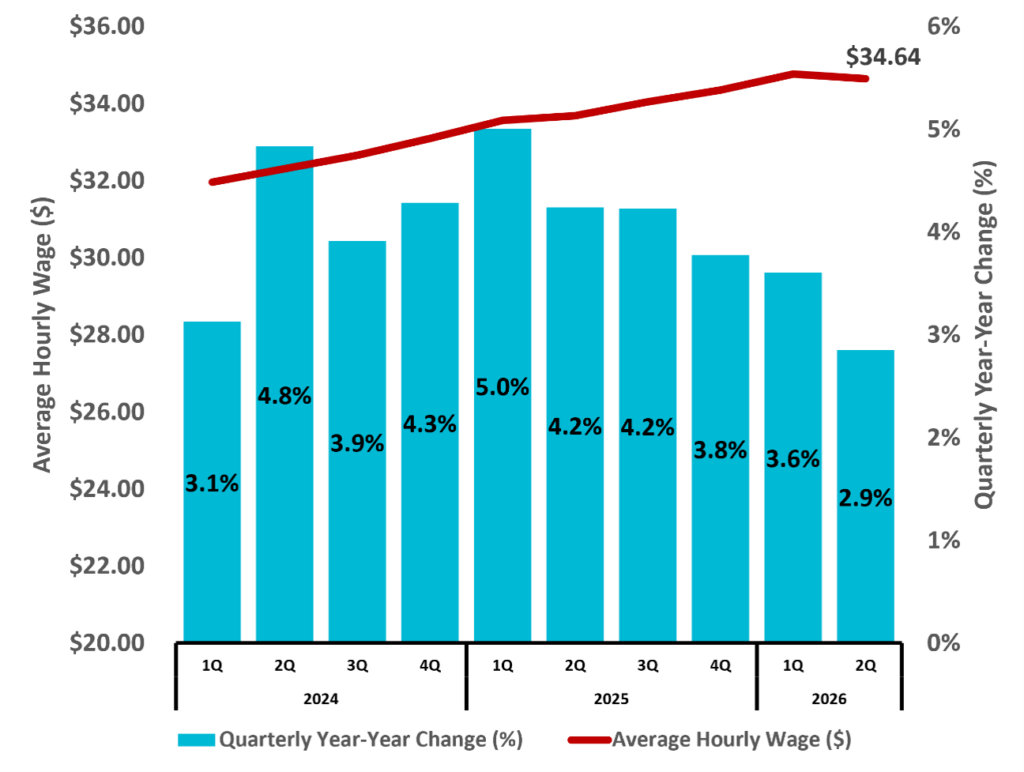
Source: NC Department of Commerce
Average hourly wages were led by Charlotte at $38.10 and Raleigh at $38.00, the only metros in the second quarter to exceed both the national average of $37.41 and the state average of $34.64 (Figure 7). The lowest average hourly wage was recorded by Goldsboro at $24.06, a difference of $14.04 per hour from Charlotte.
Figure 7 North Carolina Metros – 2026 2Q Average Hourly Wages Private Industry
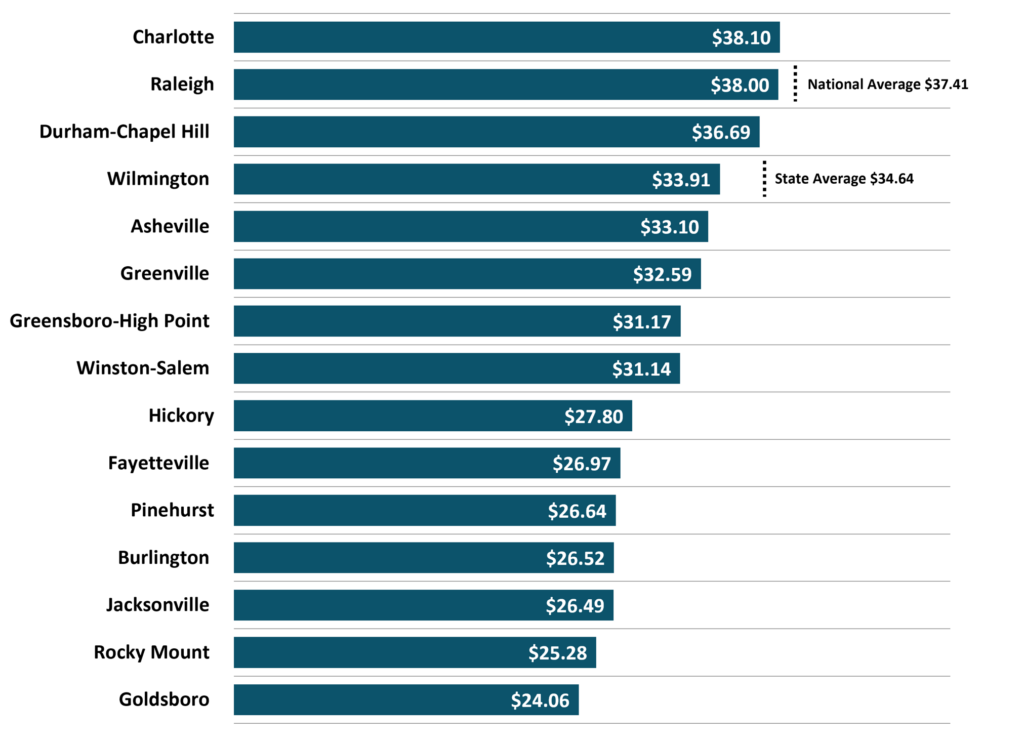
Source: NC Department of Commerce
Housing
North Carolina’s annual house price appreciation rate was 2.4 percent in the second quarter of 2026, compared with the national rate of 3.0 percent (Figure 8). Burlington recorded the highest appreciation rate among the state’s fifteen metros at 5.4 percent. Pinehurst and Rocky Mount declined by 2.2 percent each and were the only metros in the state to record house price declines.
Figure 8 North Carolina Metros Annual Appreciation Rate (%) 2026 2Q
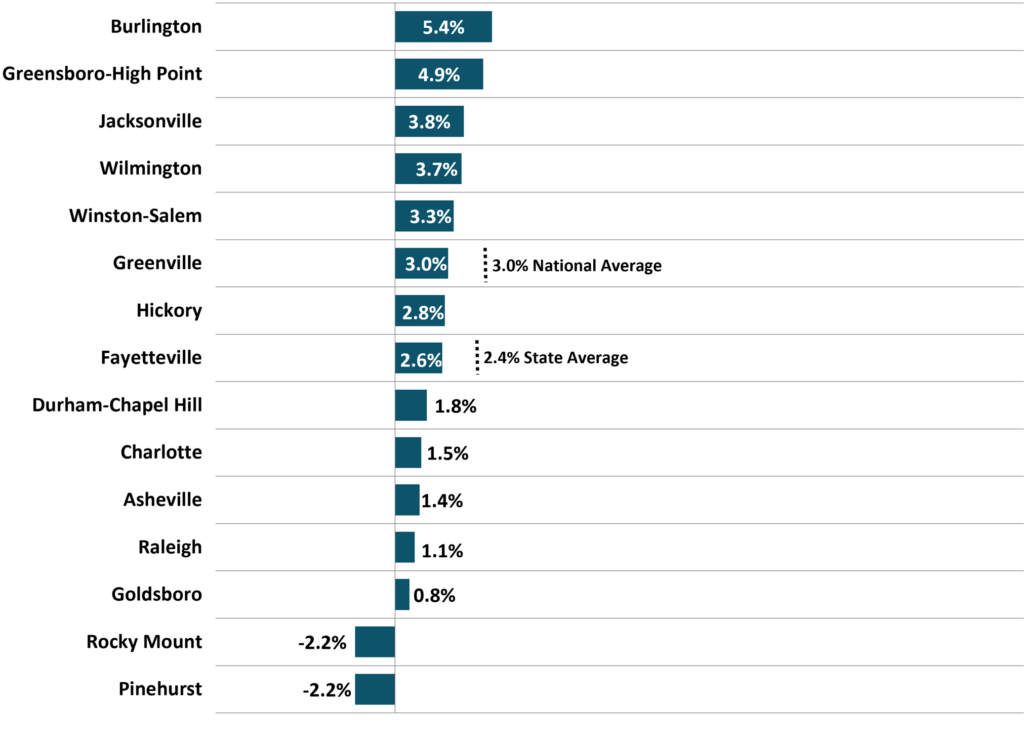 Source: US Federal Housing Finance Agency, All-Transactions House Price Index, retrieved from Federal Reserve Bank of St. Louis
Permit activity for new residential building in North Carolina totaled 26,063 units in the second quarter (Figure 9). Both the number of units and the permitted value of $6,595,292,000 were the highest quarterly totals tracked back to 2022. The number of units permitted increased 18.2 percent year-over-year while total permitted value increased by 11.0 percent. Growth in units was driven by multi-family permitting with 8,656 multi-family units, or approximately 33 percent of units permitted — up 96.5 percent compared to the second quarter of 2025.
Figure 9 North Carolina Estimated Residential Building Permit Activity
 Source: US Census Bureau
Retail Sales
Taxable retail sales in North Carolina totaled $66,861,817,319 ($67 billion) in the second quarter of 2026, marking a new high point (Figure 10). Sales increased 5.4 percent year-over-year, a larger increase than in the second quarters of both 2024 and 2025 (Figure 11).
Figure 10 North Carolina Total Taxable Retail Sales
 Includes collections of penalties, interest, and sales & use tax; and may reflect activity from prior periods. Source: NC Department of Revenue
Figure 11 North Carolina Total Taxable Retail Sales Quarterly Year-to-Year Change (%)
 Includes collections of penalties, interest, and sales & use tax; and may reflect activity from prior periods. Source: NC Department of Revenue
Special Feature: North Carolina Means of Transportation to Work
How North Carolinians report means of transportation to work has changed since 2019, largely reflecting an increase in the share working from home (Figure 12). In 2024, 15.4 percent of workers worked from home, more than double the 6.7 percent share in 2019, and women were more likely than men to do so (17.0 percent compared with 13.9 percent). Over the same period, the share commuting by car, truck, or van fell from 88.9 percent to 80.7 percent, while the remaining modes were relatively steady.
Figure 12 North Carolina Means of Transportation to Work
 Source: US Census Bureau, American Community Survey, 1-Year Estimates
The business landscape is complex. Need help? Contact DMJPS.
For a printer-friendly version, click here.
End note: Data in this report reflect a point in time, September 2026, and may be subject to periodic adjustment.