
Highlights:
DMJPS is pleased to provide the third quarter 2025 economic update across North Carolina’s fifteen metro areas. While select indicators point to moderating growth — including a slower pace of home price appreciation — the state’s economy continued to expand, supported by broad-based job gains, rising wages, and strong consumer spending. Labor market and wage trends varied across metros, suggesting both statewide strength and regional differences.
- In the third quarter of 2025, North Carolina’s employment averaged 5,085,300 jobs, a year-over-year increase of 86,300 jobs that exceeded the gain recorded in the third quarter of 2024.
- In the third quarter of 2025, North Carolina’s employment averaged 5,085,300 jobs, a year-over-year increase of 86,300 jobs that exceeded the gain recorded in the third quarter of 2024.
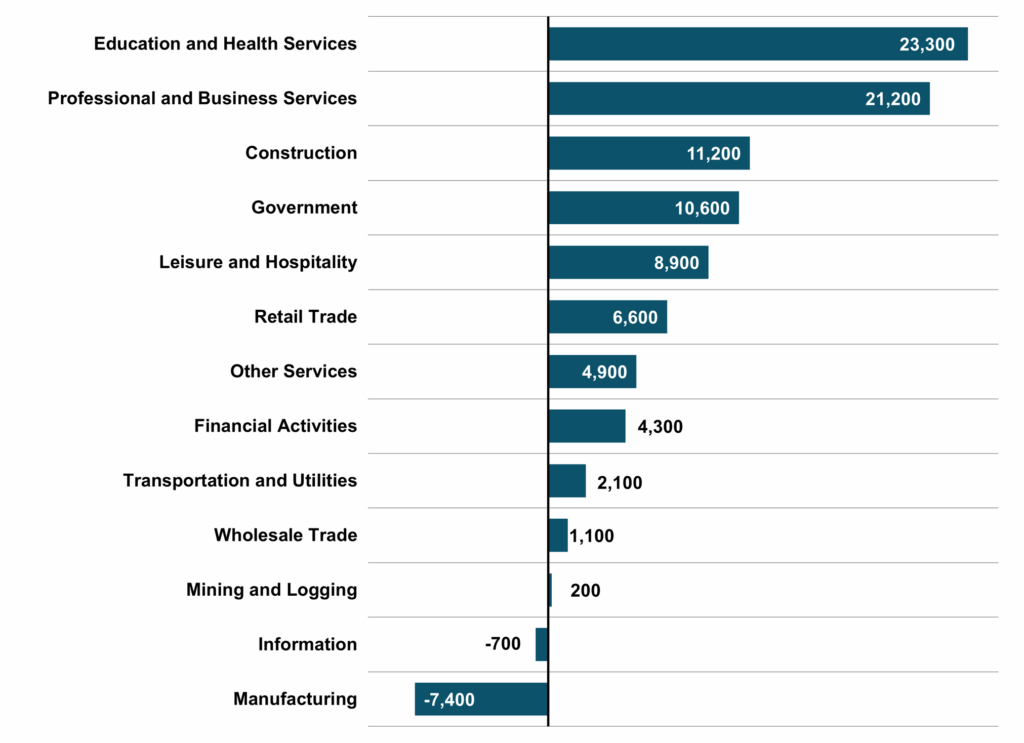
- By industry, Education and Health Services led job growth in the third quarter, adding an estimated 23,300 jobs year-over-year.
- North Carolina’s unemployment rate averaged 3.8 percent in the third quarter, representing approximately 203,869 unemployed individuals, an increase of 2.6 percent from a year earlier.
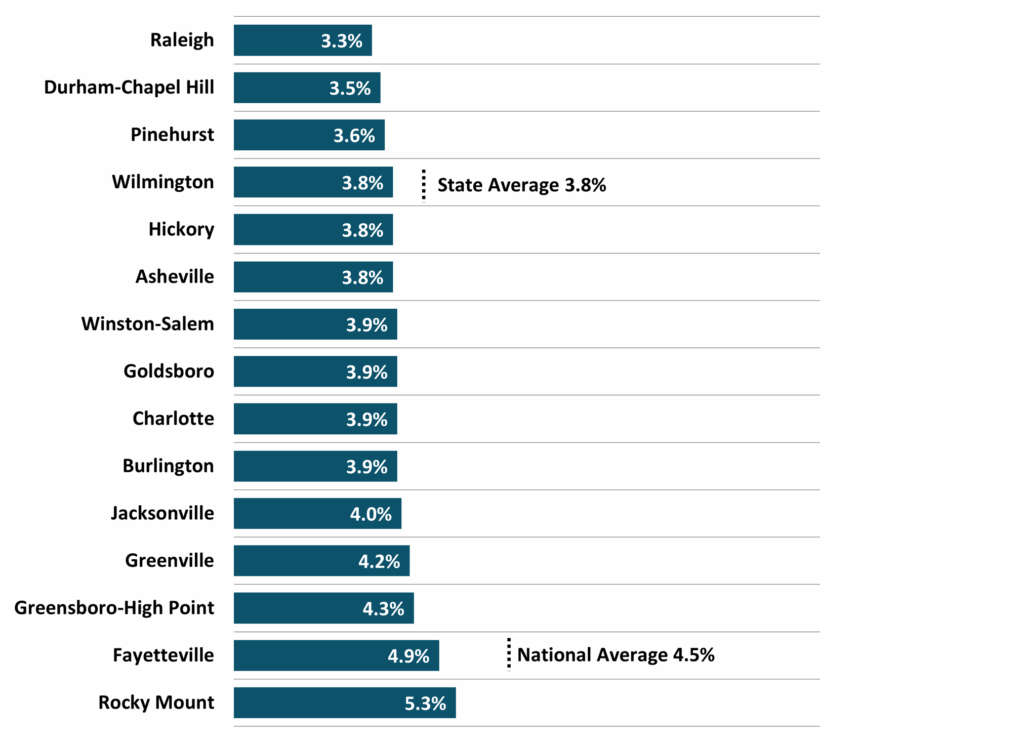
- Among the state’s fifteen metros, Raleigh posted the lowest unemployment rate at 3.3 percent, while Rocky Mount recorded the highest rate at 5.3 percent.
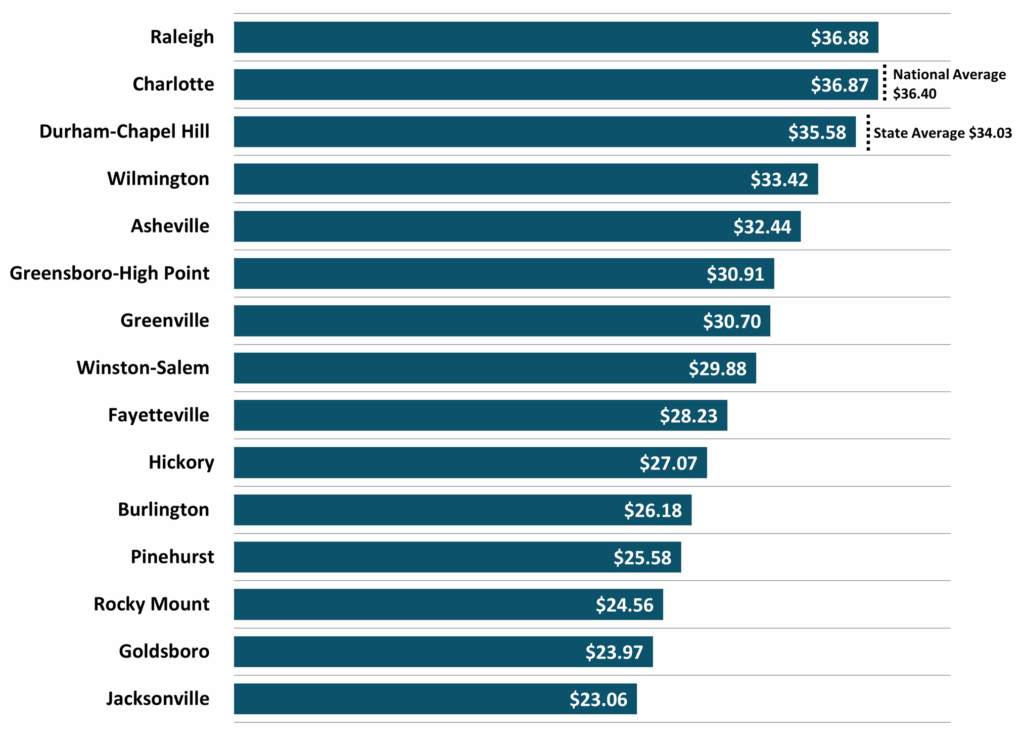
- The state’s average hourly wage in the third quarter was $34.03, up 4.2 percent year-over-year, with Raleigh leading the metros at $36.88.
- Taxable retail sales in North Carolina totaled nearly $64 billion in the third quarter, a notable 6.8 percent increase year-over-year.
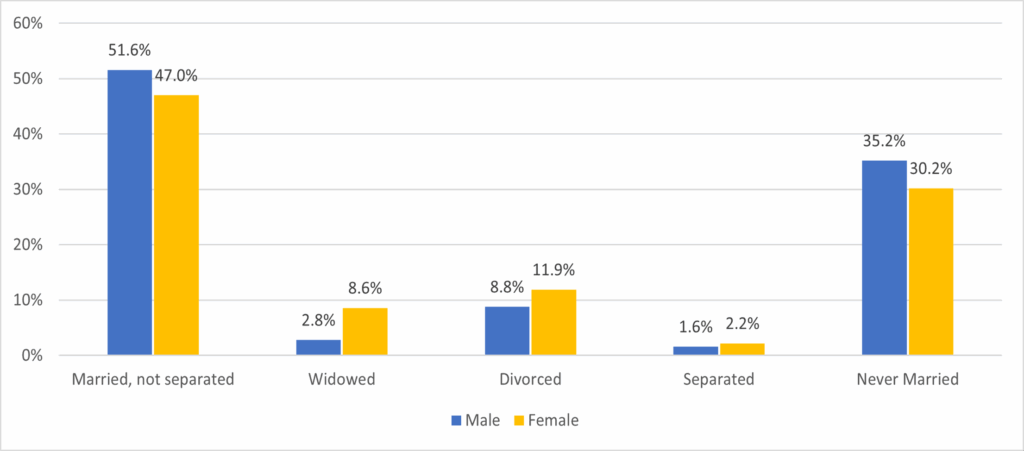
- Special feature, North Carolina Marital Status by Sex: In North Carolina, a slight majority of males were married compared to females, while females accounted for a somewhat higher share of adults who were widowed, divorced, or separated in 2023. Differences in marital status by sex may help inform household composition characteristics and related service demand.
Detailed Analysis: Employment
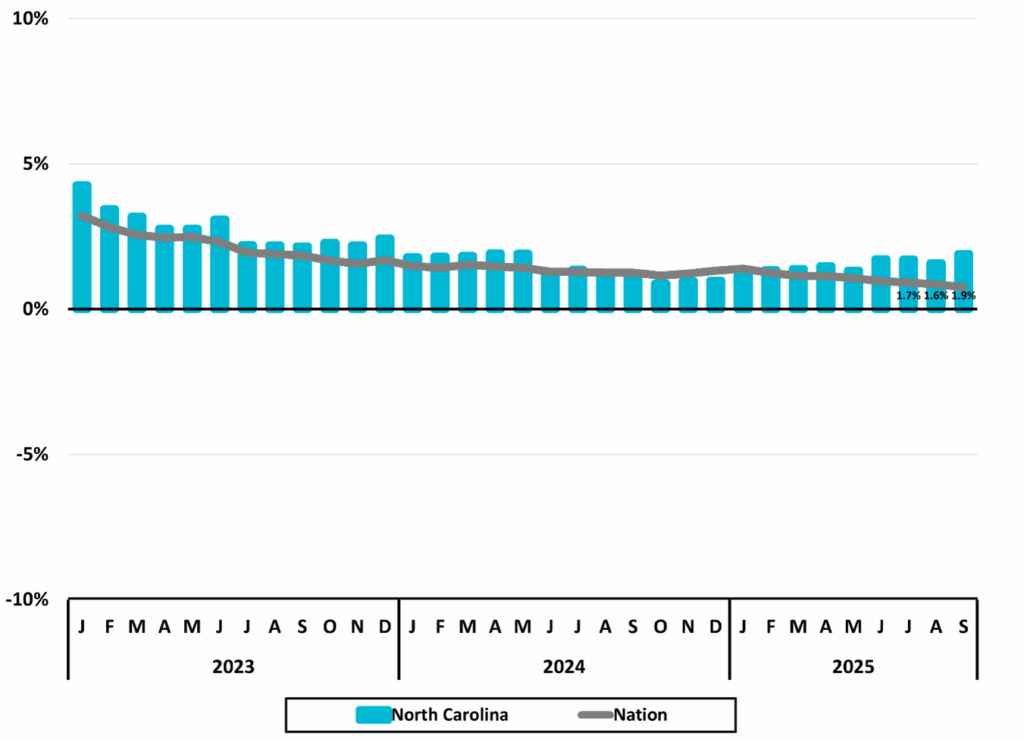
In the third quarter of 2025, North Carolina’s employment averaged 5,085,300 jobs, a 1.7 percent increase year–over–year. The state’s employment growth exceeded the national rate of 0.8 percent and has outpaced national growth for three consecutive quarters (Figure 1).
Figure 1
North Carolina Total Nonfarm Employment
Monthly Year-to-Year
Percent Change
 Source: US Bureau of Labor Statistics, All Employees, Total Nonfarm, retrieved from Federal Reserve Bank of St. Louis
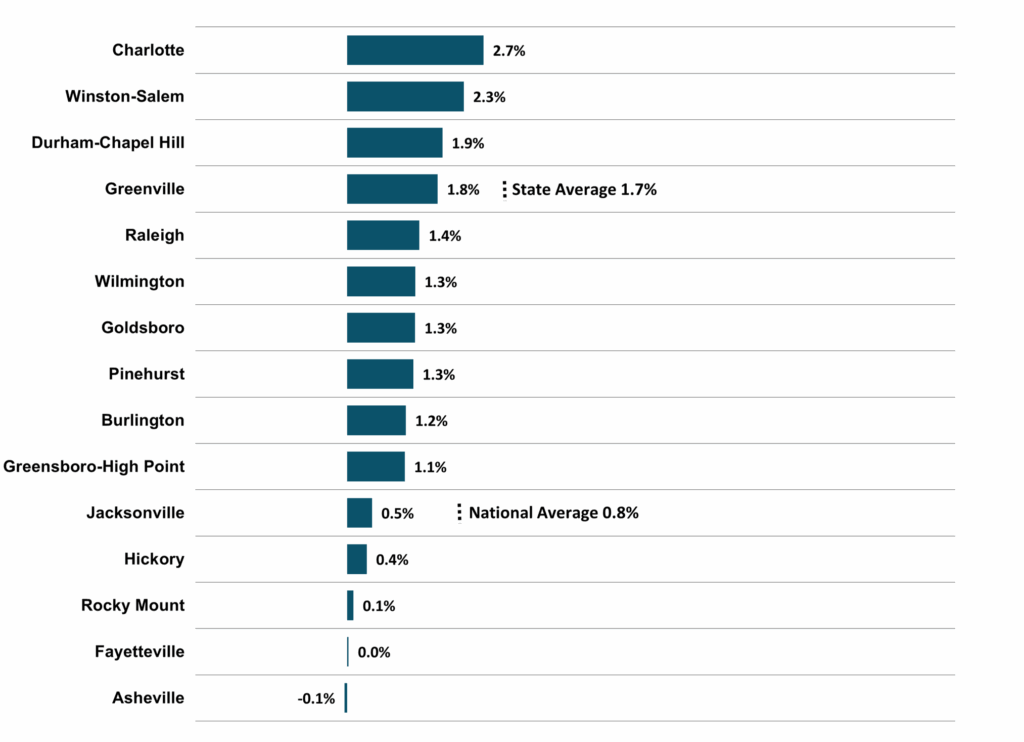
Four of North Carolina’s fifteen metro areas exceeded the state’s year-over-year employment growth rate of 1.7 percent: Charlotte (2.7 percent), Winston-Salem (2.3 percent), Durham–Chapel Hill (1.9 percent), and Greenville (1.8 percent) (Figure 2). The Asheville metro was the only metro to post a third-quarter year-over-year employment decline (-0.1 percent). This marked the fourth consecutive quarter of year-over-year job loss for the Asheville metro, following a prolonged period of growth and occurring in the quarters following Hurricane Helene. However, the magnitude of the losses has moderated in each of the past four quarters.
Figure 2
North Carolina 2025 3Q Average
North Carolina Metros Employment
One-Year Percent Change
 Source: US Bureau of Labor Statistics and Federal Reserve Bank of St. Louis, All Employees: Total Nonfarm by Metro, retrieved from Federal Reserve Bank of St. Louis
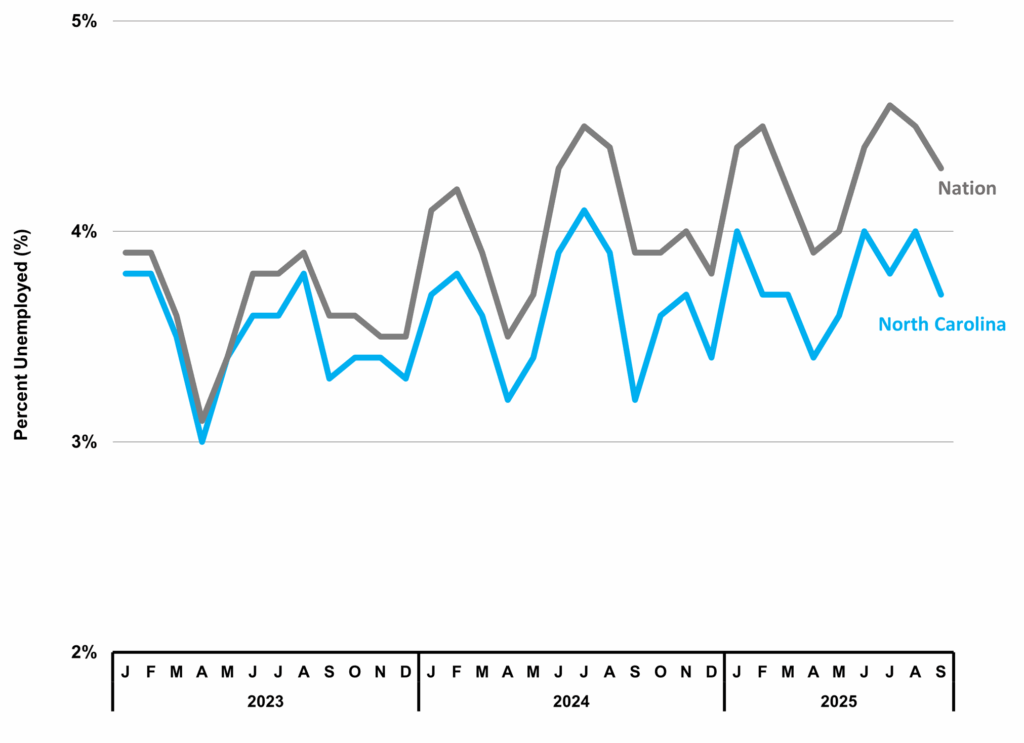
In the third quarter of 2025, North Carolina’s unemployment rate averaged 3.8 percent — 0.7 percentage points below the national average of 4.5 percent (Figure 3). This was the eleventh consecutive quarter in which the state’s unemployment rate remained below the national rate. On average, 203,869 workers were unemployed and available to work, representing a 2.6 percent increase from the same quarter a year earlier.
Figure 3
North Carolina Unemployment Rates (%)
Source: US Bureau of Labor Statistics Unemployment Rate retrieved from Federal Reserve Bank of St. Louis; NC Department of Commerce
The lowest unemployment rates among North Carolina’s fifteen metros were Raleigh (3.3 percent) and Durham–Chapel Hill (3.5 percent) in the third quarter of 2025 (Figure 4). Twelve of the state’s metros reported unemployment rates at or above the state average of 3.8 percent. Fayetteville (4.9 percent) and Rocky Mount (5.3 percent) exceeded the national average of 4.5 percent. Overall, unemployment rates were clustered across metros, with rates ranging from 3.3 to 5.3 percent statewide.
Figure 4
North Carolina Metros
Unemployment Rate (%)
2025 3Q Average
 Source: US Bureau of Labor Statistics, Unemployment Rate by Metro, retrieved from Federal Reserve Bank of St. Louis
North Carolina added approximately 86,300 jobs in the third quarter of 2025 compared to the same quarter a year earlier (Figure 5). This represented a notable acceleration from the year-over-year employment gain of 61,500 jobs recorded in the third quarter of 2024. Education and Health Services (+23,300) and Professional and Business Services (+21,200) led job growth, together accounting for more than half of the net employment gain. Only two major industries reported year-over-year employment losses: Information (-700) and Manufacturing (-7,400).
Figure 5
2025 3Q Major Industry Employment
One-Year Change
 Totals rounded to the nearest 100. Source: US Bureau of Labor Statistics, All Employees by Major Industry in North Carolina, retrieved from Federal Reserve Bank of St. Louis
Wages
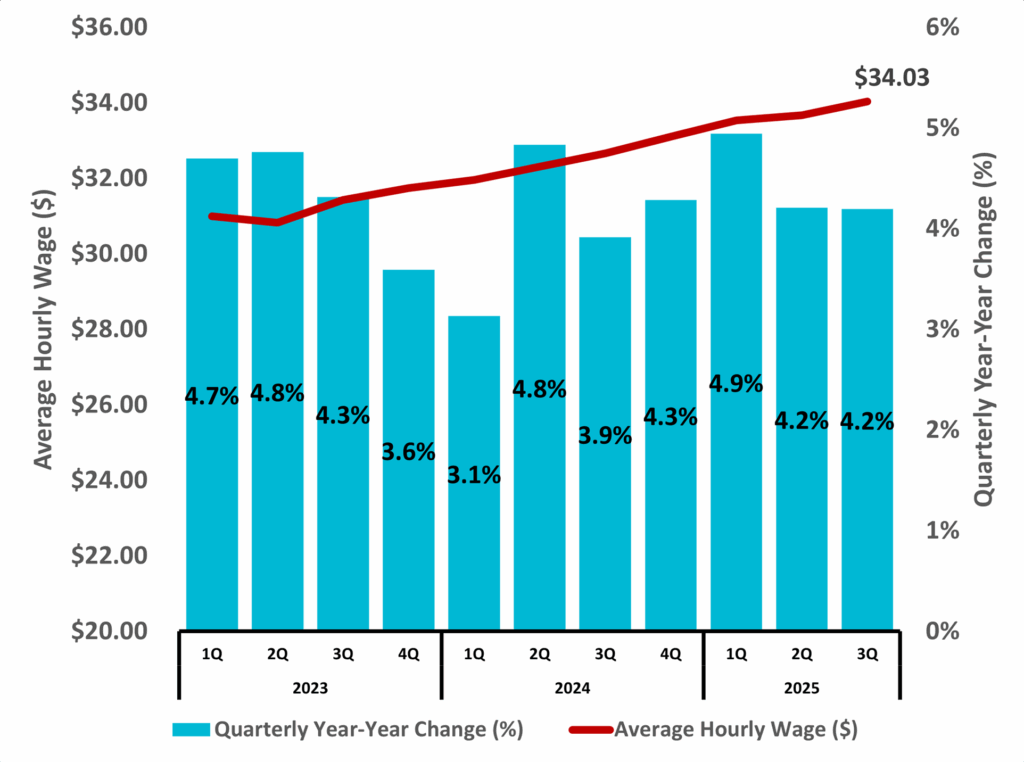
Continuing its quarterly upward trend, North Carolina’s average hourly wage rose to $34.03 in the third quarter of 2025, an increase of 4.2 percent from a year earlier (Figure 6). The third-quarter growth rate matched that of the second quarter of 2025 and exceeded the year-over-year increase of 3.9 percent recorded in the third quarter of 2024.
Figure 6
North Carolina
Average Hourly Wages
Private Industry
 Source: US Bureau of Labor Statistics and Federal Reserve Bank of St. Louis, Average Hourly Earnings of All Employees: Total Private in North Carolina
Raleigh recorded the highest average hourly wage among North Carolina’s fifteen metros at $36.88, narrowly surpassing Charlotte at $36.87 (Figure 7). Both metros exceeded the national average of $36.40. Durham–Chapel Hill ranked third at $35.58, exceeding the state average of $34.03 but remaining below the national average. The gap between the highest and lowest wage metros was $13.82 per hour.
Figure 7
North Carolina Metros
2025 Average Hourly Wages
Private Industry
 Source: US Bureau of Labor Statistics and Federal Reserve Bank of St. Louis, Average Hourly Earnings of All Employees: Total Private by Metro, retrieved from Federal Reserve Bank of St. Louis
Housing
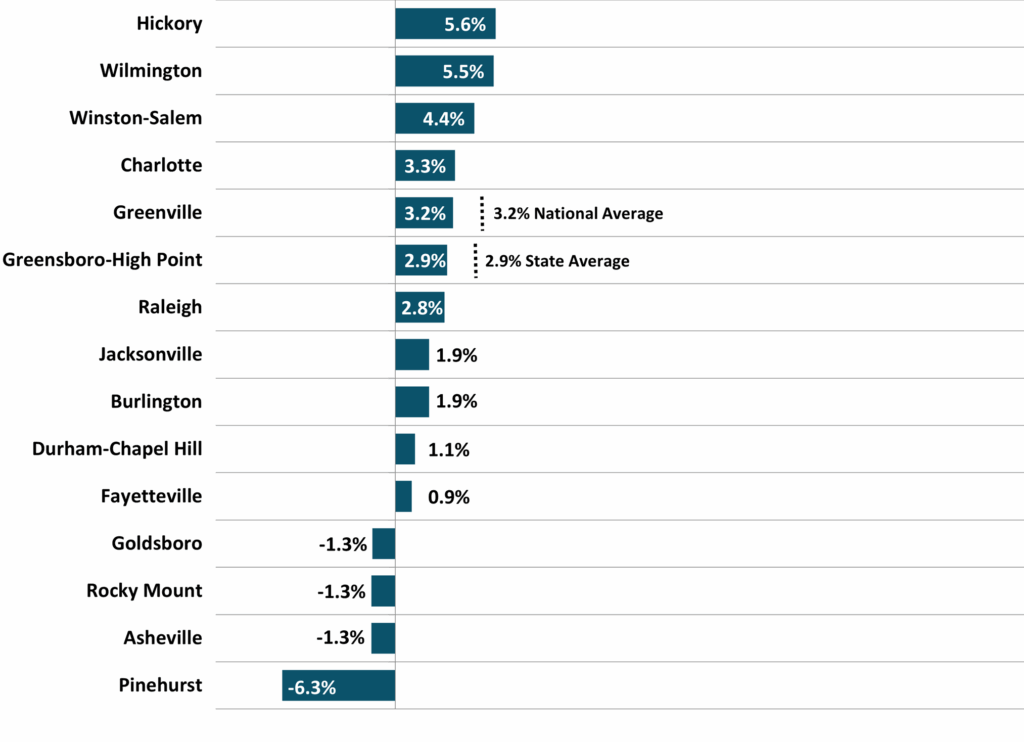
North Carolina’s annual house price appreciation rate was 2.9 percent in the third quarter of 2025, below the national rate of 3.2 percent (Figure 8). This marked the lowest quarterly appreciation rate since the third quarter of 2014. Hickory (5.6 percent) and Wilmington (5.5 percent) led the state’s metros, while four metros recorded declines: Pinehurst (-6.3 percent), Asheville (-1.3 percent), Rocky Mount (-1.3 percent), and Goldsboro (-1.3 percent). Charlotte, Winston-Salem, Wilmington, and Hickory exceeded the state’s overall appreciation rate.
Figure 8
North Carolina Metros
Annual Appreciation Rate (%)
2025 3Q
 Source: US Federal Housing Finance Agency, All-Transactions House Price Index, retrieved from Federal Reserve Bank of St. Louis
Permit activity for new residential building in North Carolina totaled 21,107 units in the third quarter of 2025 with a value of $5,691,431,000 (Figure 9). This represented a year-over-year decline of 16.6 percent in the number of units permitted, while total permitted value decreased by 8.3 percent. Multi-family units accounted for 5,537 permits, or approximately 26 percent of units permitted.
Figure 9
North Carolina
Estimated Residential Building Perits Activity*
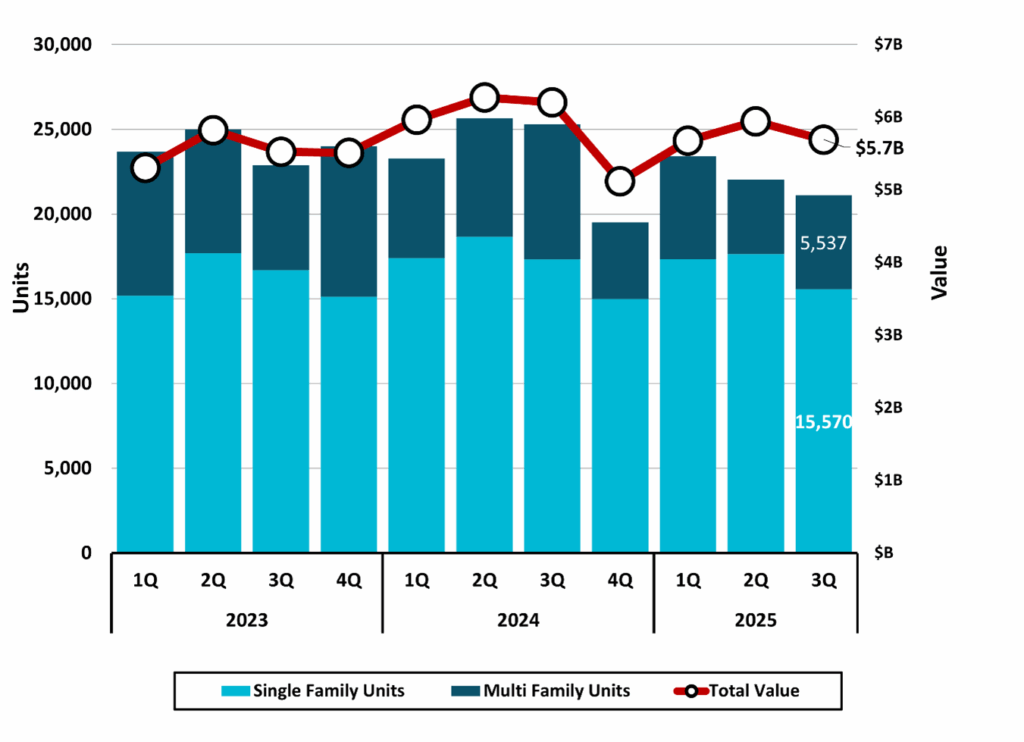 *Based on a survey of permitting agencies. The Census Bureau estimates any missing agency data, which typically amounts to less than 20% of the total permits. Source: US Census Bureau
Retail Sales
Taxable retail sales in North Carolina totaled $63,669,599,680 ($64 billion) in the third quarter of 2025 (Figure 10). Year-over-year growth of 6.8 percent surpassed the previous quarter’s pace, establishing the highest year-over-year growth rate since the first quarter of 2023 (Figure 11).
Figure 7
North Carolina
Total Taxable Retail Sales
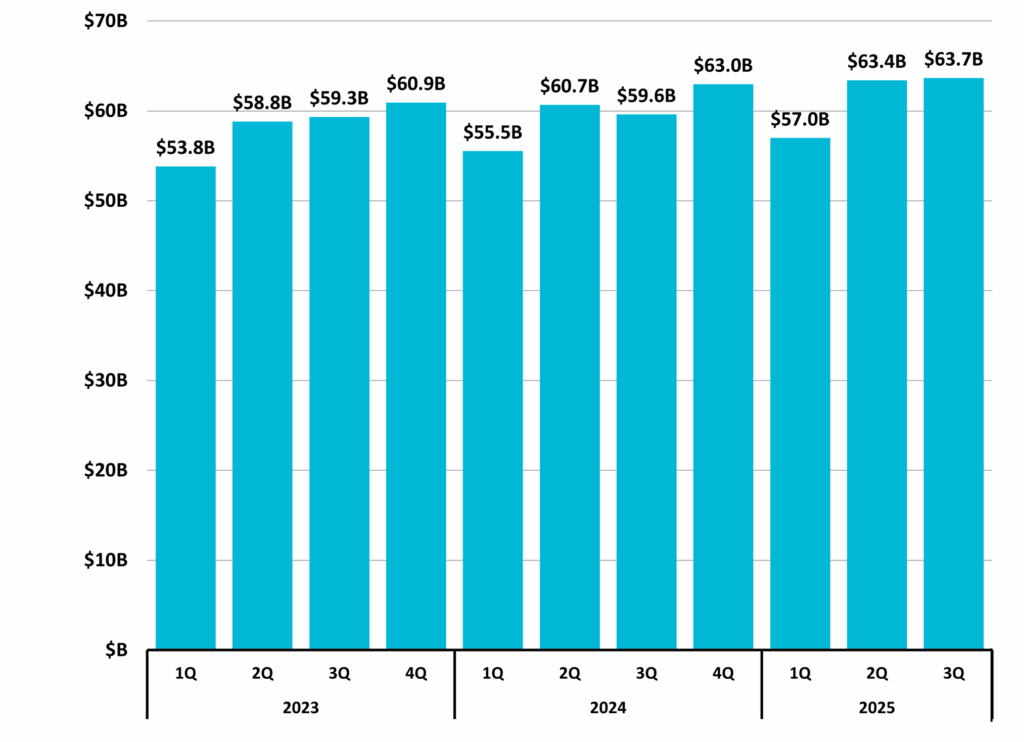 Includes collections of penalties, interest, and sales & use tax; and may reflect activity from prior periods. Source: NC Department of Revenue
Figure 11
North Carolina
Total Taxable Retail Sales
Quarterly Year-to-Year Change (%)
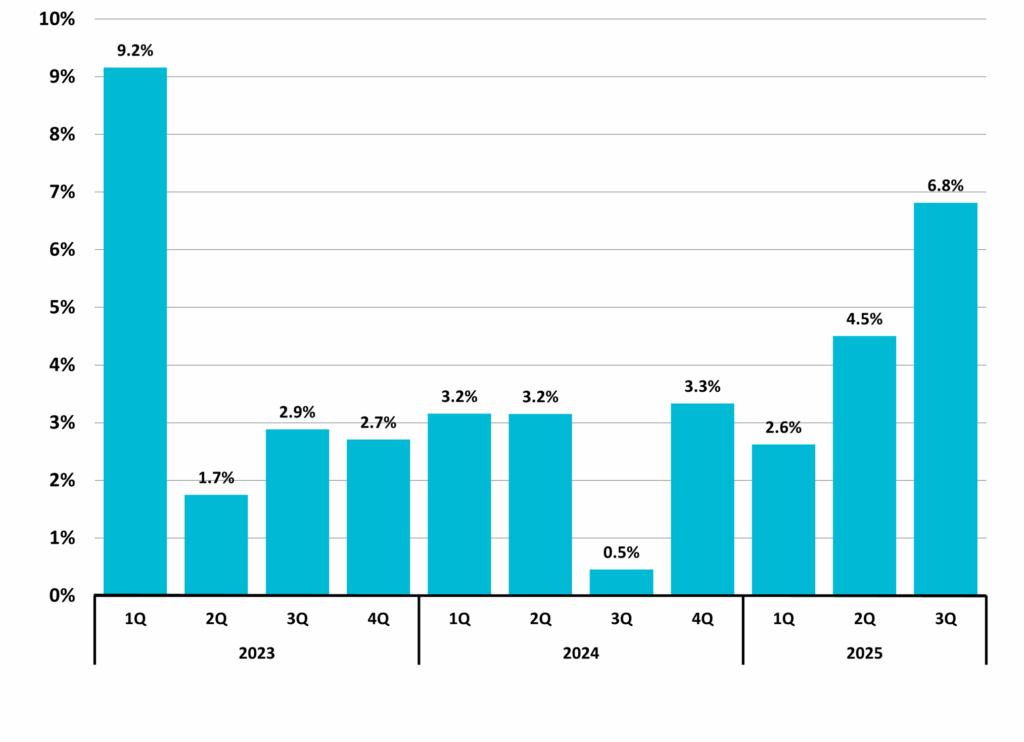 Includes collections of penalties, interest, and sales & use tax; and may reflect activity from prior periods. Source: NC Department of Revenue
Special Feature: North Carolina Marital Status by Sex
A broad look at marital status in North Carolina may offer a general snapshot of household formation trends. Based on 2023 Census estimates, married adults accounted for the largest single category and comprised a slight majority among males (51.6 percent), while never-married adults represented 35.2 percent of males and 30.2 percent of females (Figure 12). A large share of adults were not married among both males and females, which could have implications for related market dynamics. Females accounted for a somewhat higher share of adults who were widowed, divorced, or separated compared to males. These demographic characteristics may have implications for service needs, including housing, financial products, and healthcare associated with household composition.
Figure 12
North Carolina
Marital Status by Sex
Source: US Census Bureau, 2023 American Community Survey, 1-Year Estimates
Update on Metropolitan Statistical Area Delineation Changes:
The third quarter 2025 report reflects revisions to metropolitan statistical area delineations (MSAs or metros) in North Carolina, as defined by the Office of Management and Budget (OMB). These changes include the following:
- The New Bern metro has been redesignated as a Micropolitan Statistical Area.
- Moore County now constitutes the new Southern Pines–Pinehurst metro area.
- The Asheville metro no longer includes Haywood County and consists of Buncombe, Henderson, and Madison counties.
- Anson County has been added to the Charlotte-Concord-Gastonia metro area.
- Brunswick County has been added to the Wilmington metro area.
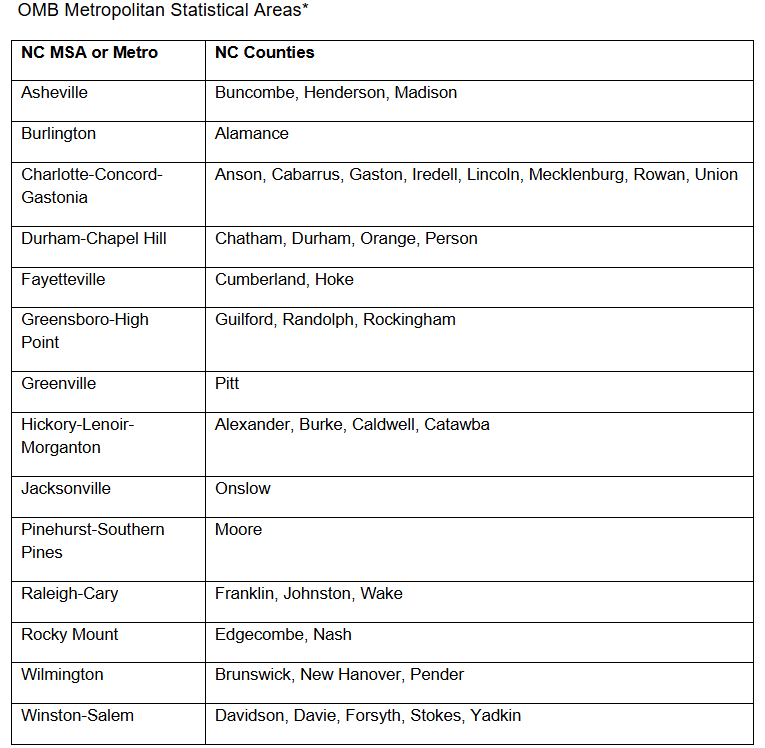
* Not included: Virginia Beach-Chesapeake-Norfolk MSA
Source: NC Department of Commerce
The business landscape is complex. Need help? Contact DMJPS.
For a printer-friendly version, click here.